How to delete stray data from ESP8266 SD card?

Hi - I’ve got two IotaWatts, love them. Brilliant.

However, a question: Occasionally I get bad data (glitches of some sort?) stored in the SD card, which screws up any graphs that contain those datapoints. Seems to usually happen to the IMPORT and EXPORT outputs, which derive from the GRID integrator (I set those up according to docs found on this site), but I’ve seen an occasional glitch on simpler outputs as well.

How can I remove those datapoints to allow my graphs to display normally? I’ve attached some graphs to better illustrate what I’m talking about.

(I did a quick search of the forum but didn’t find what I needed. If it’s already here, a pointer would be much appreciated…)

Thanks…
chico

Unfortunately no can do. The datalogs maintain watts as cumulative Wh so every entry becomes a part of the subsequent entry. To change it would require going through all of the subsequent data, which is prohibitively time and resource consuming on the ESP8268/SD. But there are a few things you can do.

You can set the Yaxis limits to scale it back down.

From what you say, it’s probable this is a something with the integrator. Look in the message log. Is there anything that happened at that time? Did the unit restart? There could be a timing or race condition that is causing it. If you can identify unusual activity, I’ll take a look at it.

Thanks for the response. I understand the constraints imposed by the data collection and storage methodology.

I had no data issues until I installed a PV system and, as per the iotaWatt documentation, created the “grid” integration and associated “import” and “export” outputs.

While they’ve generally worked as expected, I noticed that if I leave a graph with multiple outputs (see graph attachment) running on my Macbook Pro, and then also access the same graph with my iPhone, the iotaWatt will sometimes lock up. It will stop updating the graphs or refresh the web page graph. Sometimes it’s pingable, other times not. In the former case I could reset the device via the web interface; in the latter I needed to cycle power.

As a result, I’m hesitant to access iotaWatt graphs on more than one computing device simultaneously. Is this caution warranted? I’m impressed by how much you get out of an 8266 but it’s doing a lot of stuff in near-real-time!

I’ve attached the message logs I can access, but they only go back a couple of days. (Note the multiple restarts.) Is there a way to retrieve previous diagnostic data?

In the documentation about creating the integrator, I think I understand the reasoning behind it…it’s to capture all the import and export data, not just that occurring at the 5 second sample points…? Or…?

What I’m not clear on is where and when integrations are useful aside from simple graphical displays, which can be created without resorting to integration. Is there a place in the documentation or forums where this might be explained further?

Thanks…

chico

Typical graph I’m using:

Log file:
iotawat_log.txt (9.5 KB)

…regarding my question about accessing data logs:

The log I sent was from the TOOLS > MESSAGE LOG menu.

I see in the STATUS menu that there are also HISTORY and GRID logs, as described in the documentation. But it’s not clear to me how to access these logs…?

The IoTaWatt doesn’t update the graphs or status display. Those applications refresh themselves using a JavaScript timer to initiate a request (query for graph, status request for status) and then update based on the data in the response. As you noticed, the ESP8266 is working hard 24/7. 66% of the time it’s measuring power in 16.6ms time slices. Everything else has to be done piecemeal using 8.33ms time slices in between. That includes the webserver and query. When you start pounding it with long queries as illustrated with 9 elements, it dims the lights a little.

If one of the queries monopolizes the processor long enough to time out another pending request, the application will usually stop refreshing. Clicking “status” again will usually restart it, or cycling the freeze/refresh button in Graph+ should start it up again. That you can access the software restart indicates the web server is still running OK.

The integrator is primarily useful to accumulate kWh imported and exported. If you don’t have net metering and thus a separate feed-in tariff, it is useful. Some battery configurations use a bi-directional connection to both charge and discharge the battery. Without an integrator, it’s not possible to see historical charge/discharge cycles. When viewing daily solar data, integrators are not needed. If you use PVoutput to track import/export, integrators are not needed.

You are getting the most recent 100K or so of the message log with the app. If you use the file manager to access /iotawatt/iotamsgs.txt you will get the whole log from the beginning of time.

Thanks for the insightful response. It all makes sense to me.

As a retired EE I dabble with various personal electronic projects, including a lot of ESP8266 and ESP32 gadgets scattered around my place. I love these cheap and powerful little wifi processors for the multitude of cool and clever things that can be built with them (“cool and clever” is my own take…when others roll their eyes at what I build, I get that too!)

But what you’ve done with the iotaWatt code is very impressive indeed. I built up a breadboard and have been playing with the code. I don’t yet understand it all, as it’s way beyond anything I’ve done so far, but I’m learning a lot, and I find it more impressive with each thing I learn!

Enough gushing…just wanted to let you to know what you’ve done under the hood is as appreciated as are the iotaWatt’s well-designed functionality and feature sets.

Thanks again…

2 Likes

Following up on this…

Yesterday I got this behavior on my “Import” output starting at 8:35 pm:

Here’s a look with the other graph items removed:

Not sure, but this might be a clue…I recently started uploading to PVoutput, which displays my AC line voltage (Input_0). I notice that there’s a voltage glitch at the same time the “Import” output starts oscillating:

I was wondering if there might be something wonky with my line voltage monitor setup (Input_0) that causes the “Import” output to go crazy, maybe something like division by zero in the script, or…?

It’s the first possible clue I’ve found as to why the “Import” output occasionally freaks out…

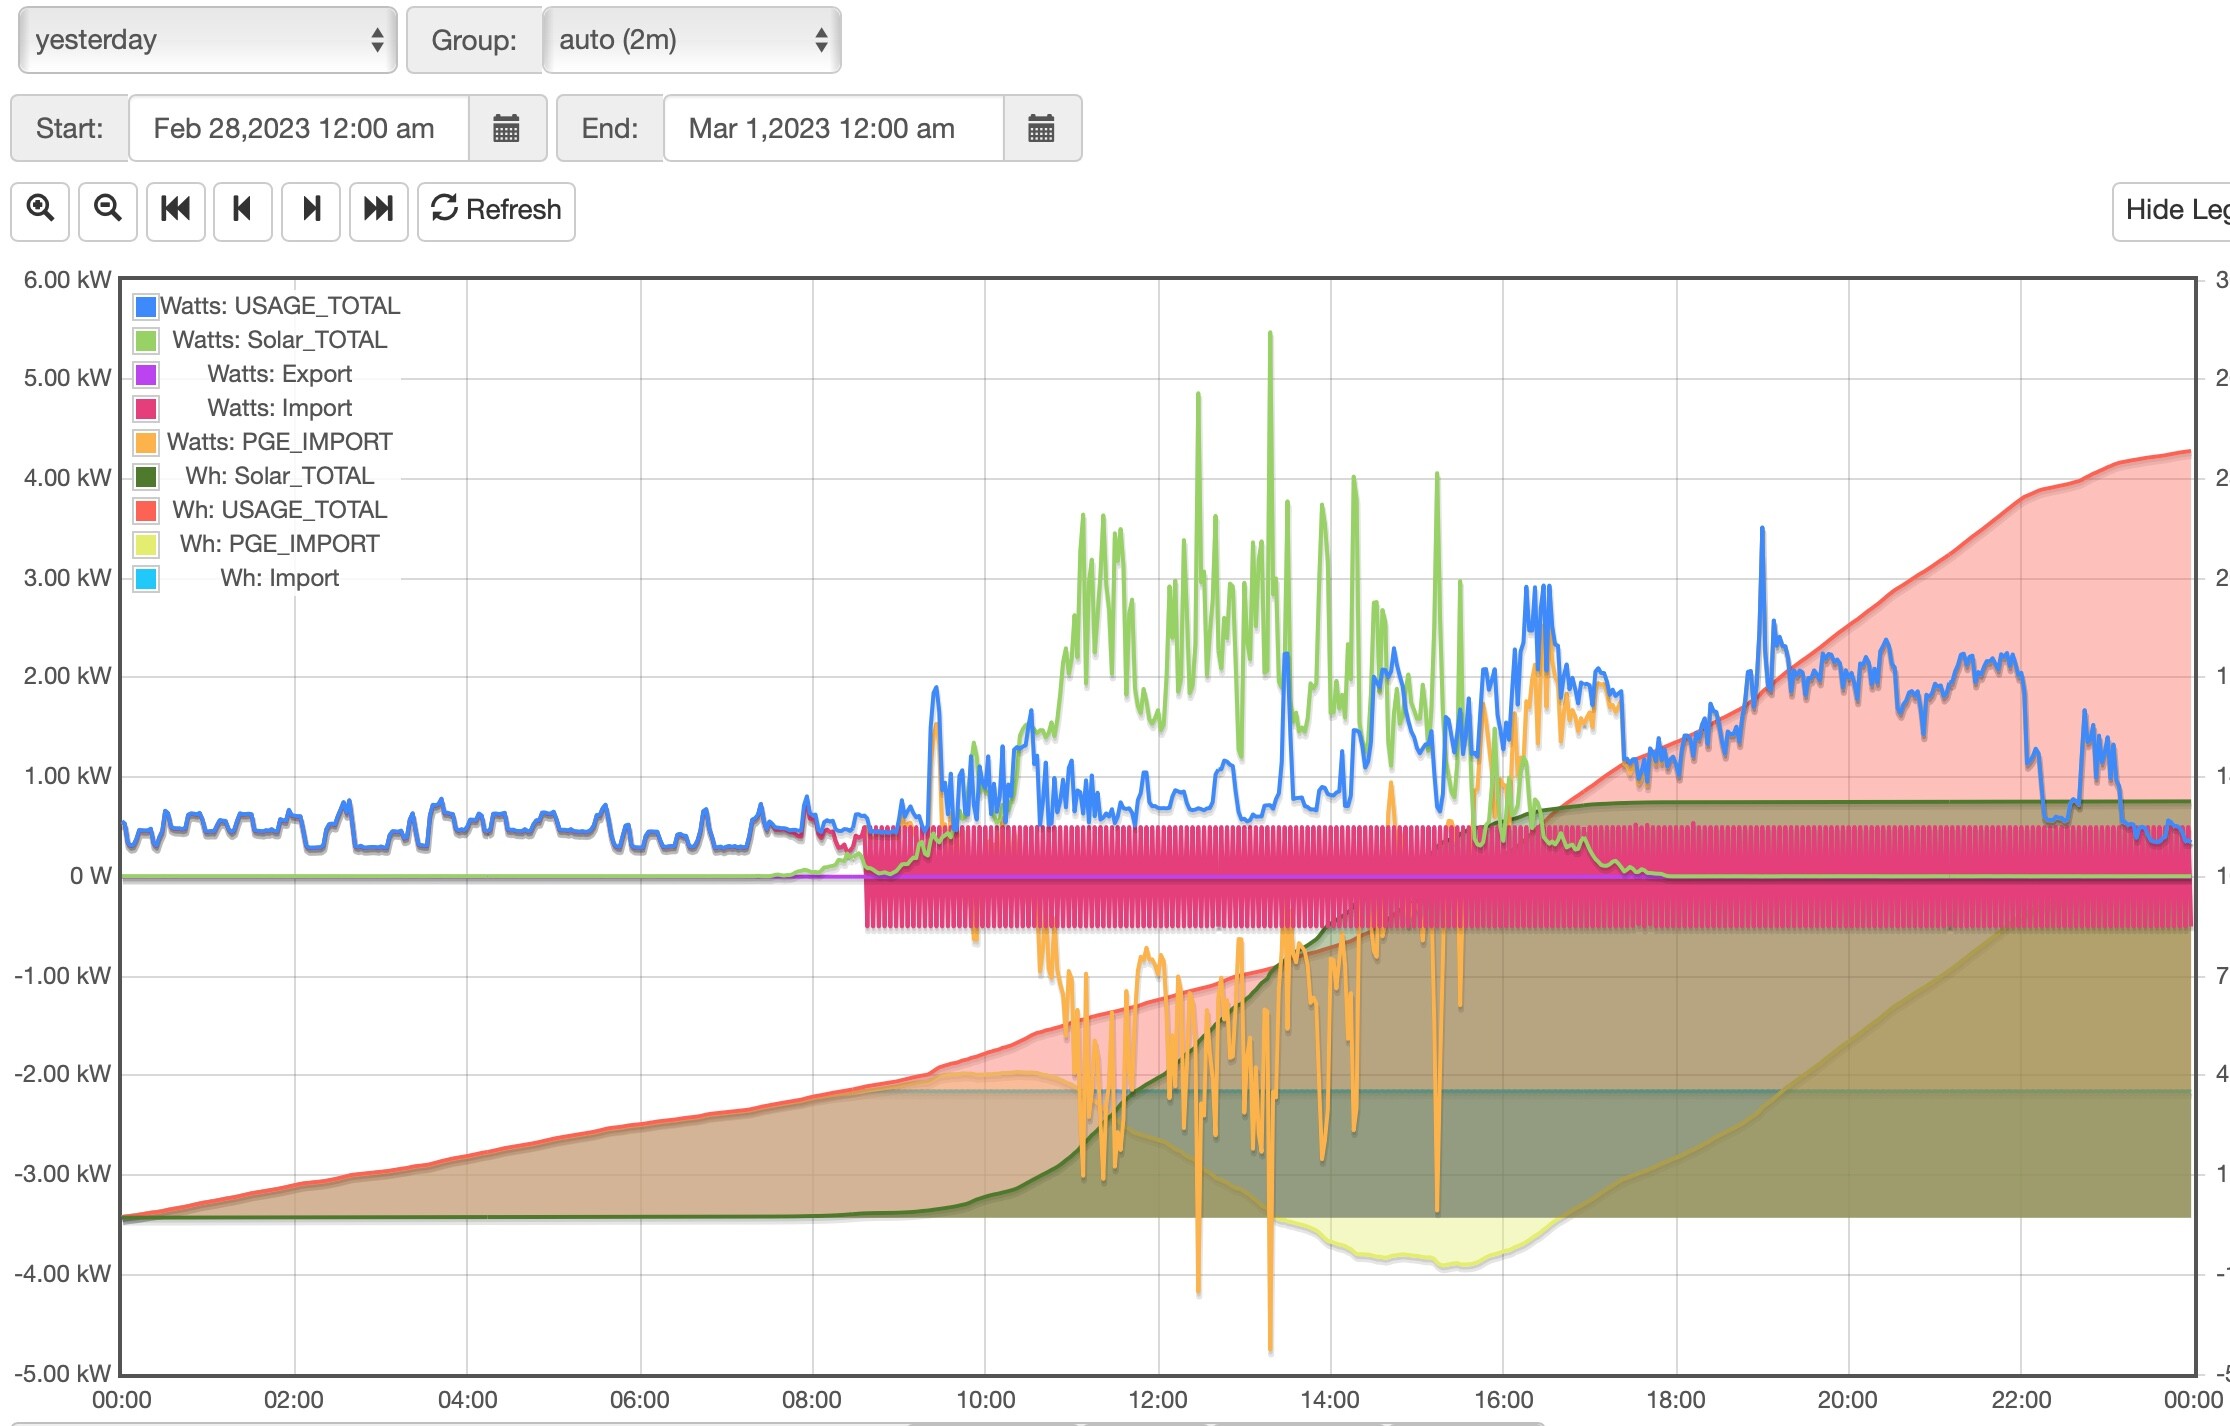
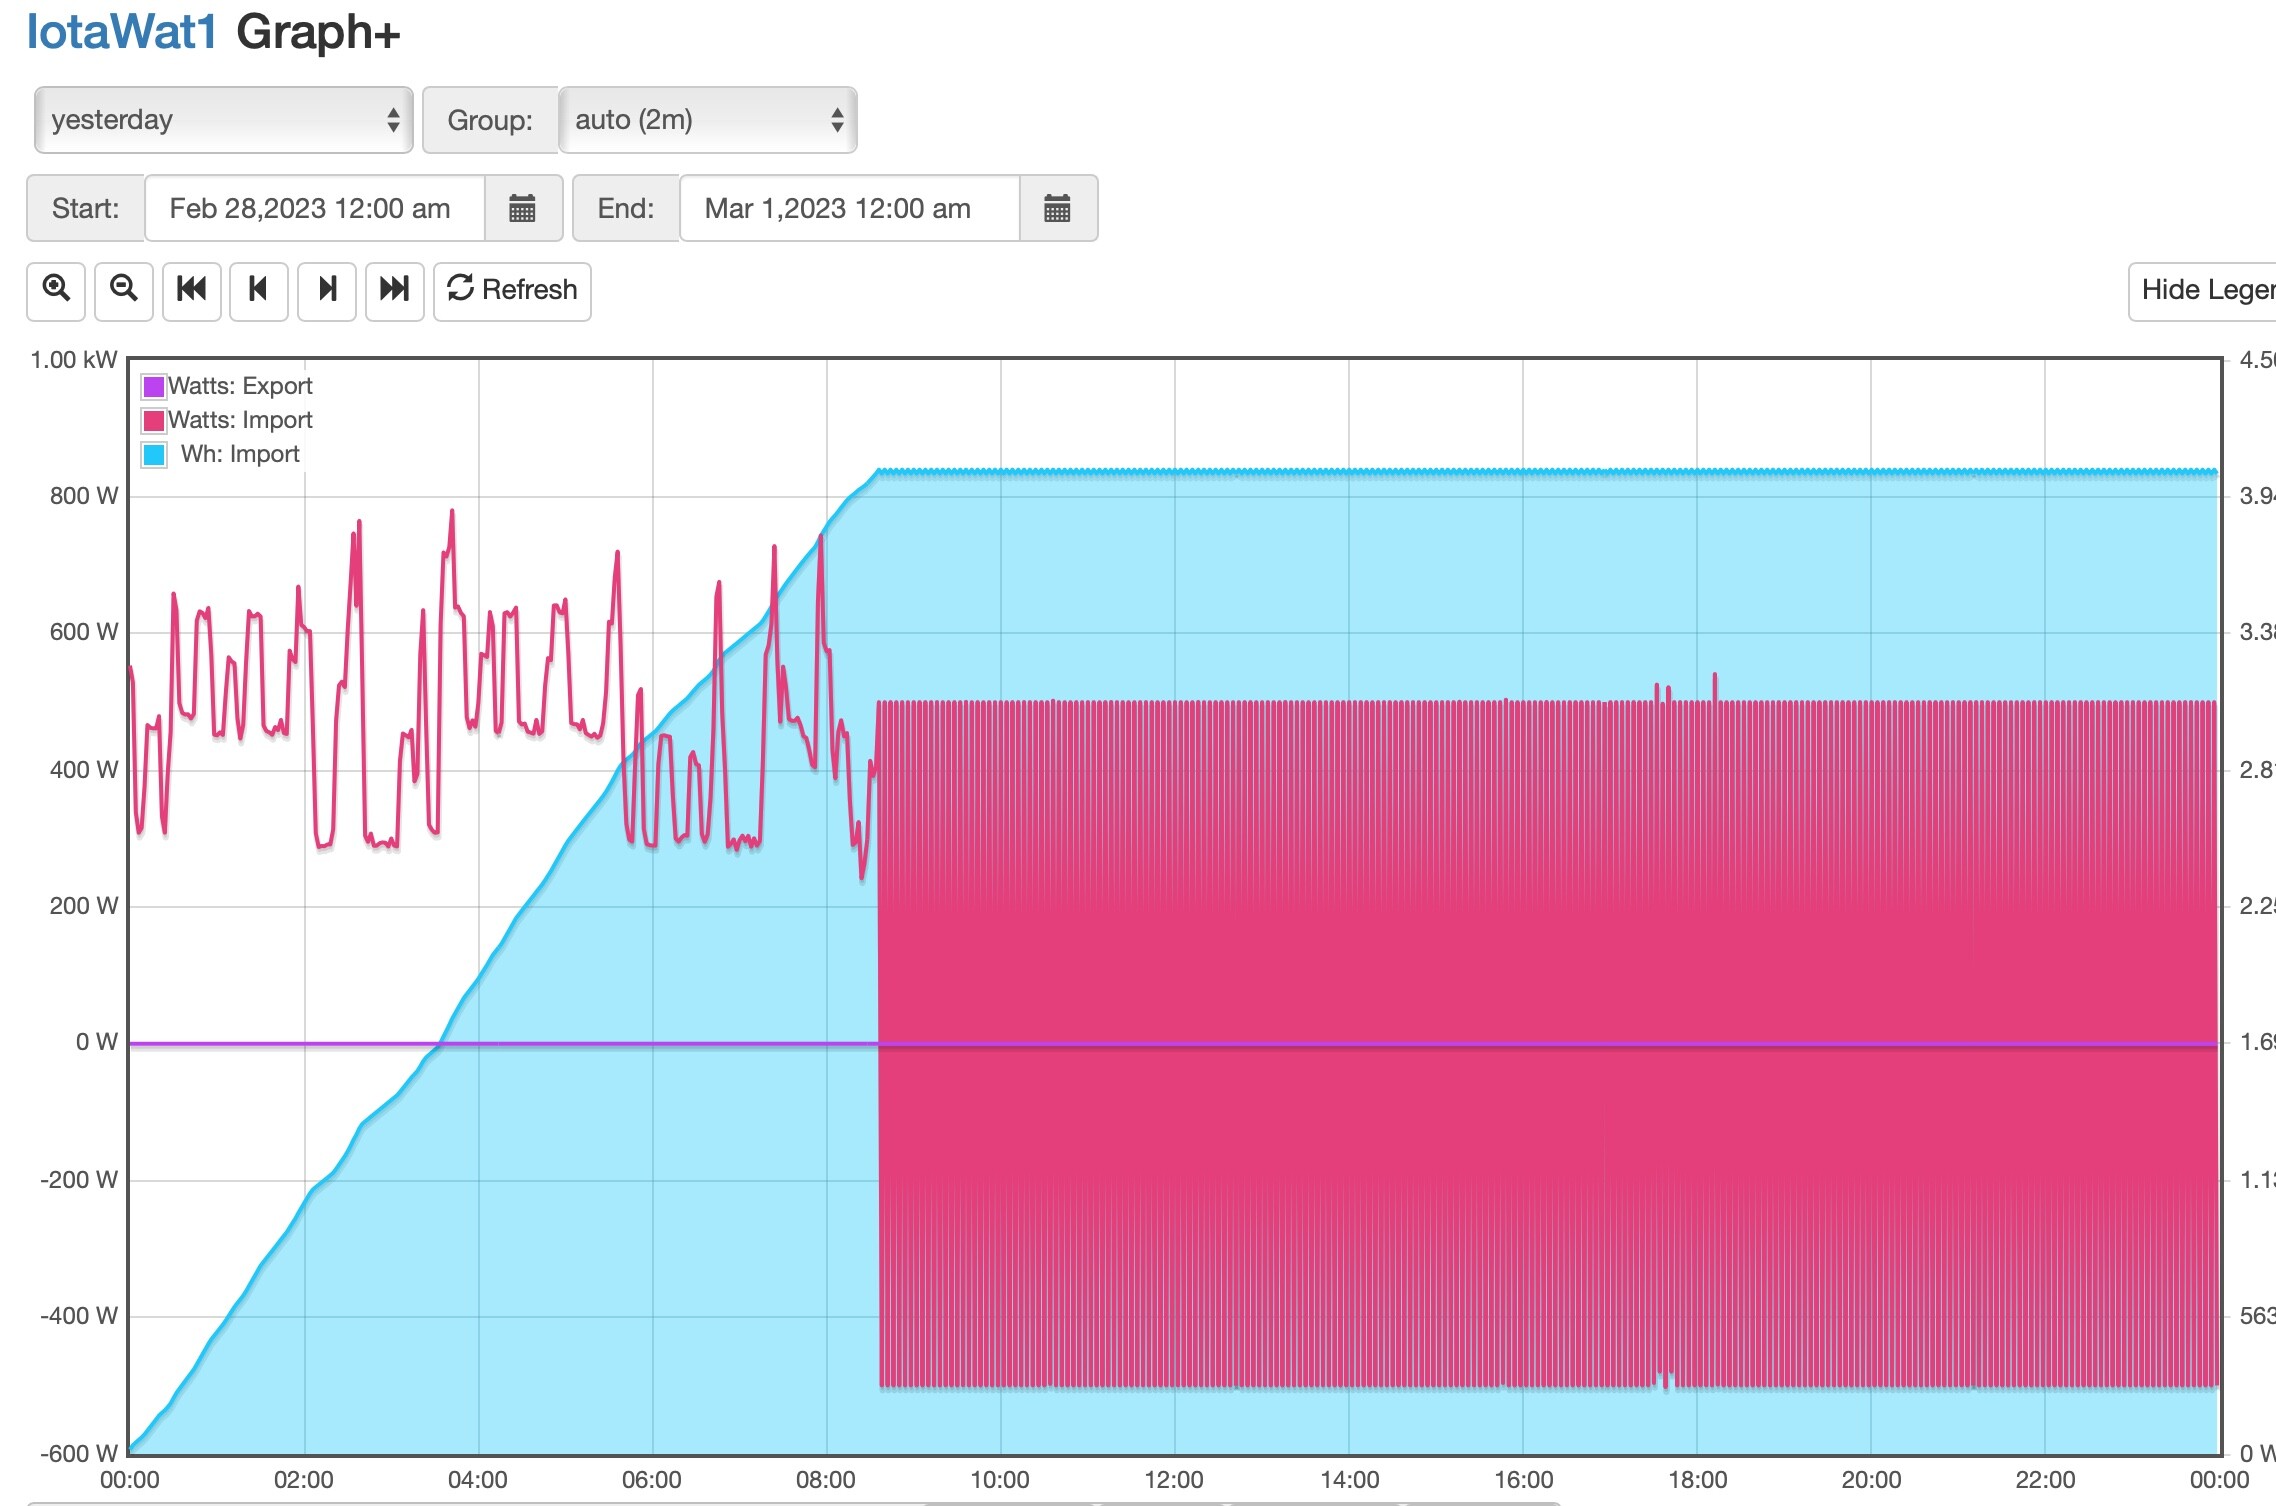
There had been a restart around 6:13pm, Watchdog expiration. Nothing in the log at the time the freakout occurred somewhat later (8:35pm):

<>

** Restart **

SD initialized.
3/01/23 02:13:01z Real Time Clock is running. Unix time 1677636781
3/01/23 02:13:01z Reset reason: Software Watchdog
3/01/23 02:13:01z Trace: 25:41, 25:50, 25:51, 25:53, 25:54, 25:60, 25:61, 25:61, 25:64, 25:65, 25:61, 25:64, 25:65, 25:61, 25:64, 25:65, 25:61, 25:64, 25:65, 25:61, 25:64, 25:65, 25:61, 25:64, 25:65, 25:55, 25:56, 25:41, 25:42, 25:41, 25:50, 25:51
3/01/23 02:13:01z ESP8266 ID: 563800, RTC M41T81 (68)
3/01/23 02:13:01z IoTaWatt 5.0, Firmware version 02_07_05
3/01/23 02:13:01z SPIFFS mounted.
2/28/23 18:13:01 Local time zone: -8:00, using DST/BST when in effect.
2/28/23 18:13:01 device name: IotaWat1
2/28/23 18:13:01 HTTP server started
2/28/23 18:13:01 timeSync: service started.
2/28/23 18:13:01 statService: started.
2/28/23 18:13:01 dataLog: service started.
2/28/23 18:13:04 dataLog: Last log entry 02/28/23 18:12:55
2/28/23 18:13:06 historyLog: service started.
2/28/23 18:13:06 historyLog: Last log entry 02/28/23 18:12:00
2/28/23 18:13:07 WiFi connected. SSID=Gochujang 2.4, IP=192.168.8.100, channel=11, RSSI -73db
2/28/23 18:13:07 MDNS responder started for hostname IotaWat1
2/28/23 18:13:07 LLMNR responder started for hostname IotaWat1
2/28/23 18:13:07 Updater: service started. Auto-update class is MINOR
2/28/23 18:13:07 Updater: Auto-update is current for class MINOR.
2/28/23 18:13:07 Grid: Started
2/28/23 18:13:07 Grid: Last log entry 02/28/23 18:12:55
2/28/23 18:13:11 PVoutput: started
2/28/23 18:13:11 PVoutput: System jayzPVoutput, interval 5, freeload mode
2/28/23 18:13:11 PVoutput: Reload status beginning 01/01/23 00:05:00
2/28/23 18:15:00 PVoutput: Unrecognized HTTP completion, upload Bad request 400: Energy value [1091885]
2/28/23 19:15:00 PVoutput: System jayzPVoutput, interval 5, freeload mode
2/28/23 19:15:01 PVoutput: Reload status beginning 01/01/23 00:05:00
2/28/23 19:20:00 PVoutput: Unrecognized HTTP completion, upload Bad request 400: Energy value [1116284]
2/28/23 20:20:00 PVoutput: System jayzPVoutput, interval 5, freeload mode
2/28/23 20:20:01 PVoutput: Reload status beginning 01/01/23 00:05:00

The WDT reset is happening while query is trying to access the datalog. Usually that means there is datalog damage. When did you get this unit? If it was late last year and you have the order number, it could be one of the units with an archaic FAT format on the SDcard. In any event, I would recommend a few things:

If you suspect problems with the VT, you really should be on release 02_08_02. It is currently ALPHA and BETA auto update, but will be going MINOR in a couple of days. It is much more tolerant of a zero voltage condition.

You appear to have the Reload History box checked on you PVoutput uploader. That causes the uploader to upload history every time the unit restarts. Once you get the system current, with the Reload box unchecked, IoTaWatt will query PVoutput to see where it left off and continue on from there. There is a 14 day limit on lookback in freeloader mode so it won’t accept anything before Feb 17 anyway.

I would recommend reformatting or replacing the SDcard, clearing everything in the /iotawatt directory.

Good stuff, thanks.

** [Order #125306] (December 11, 2021). That order included two units.

Check.

Ooops…I recall the docs telling me to uncheck it after the data was uploaded but I completely spaced out. My fault. I’ll uncheck it…

Will do. I just did similar task on a Raspberry Pi. Would it make sense to try to copy the previous data to the reformatted card or do you suspect it’s corrupt? Would the best approach to saving the data be a .csv download, or …?

Thanks…

Unfortunately, I would recommend that you start with fresh datalogs. There is no efficient way to save the data. Maybe the best way would be to do a series of graphs showing things you might have historical interest in like monthly kWh. If you want daily kWh you can get that for the past year using Graph+ with CSV download or query and save it in a spreadsheet.