The short answer is that the default capacity of 10 years will easily fit on the supplied 8GB SDcard.
The current log, which holds 5 second data, needs about 8.8MB/day. It’s limited to about 485 day’s worth of data by the allowable file size in the FAT file system. Once full, it wraps and replaces the oldest data with new. As shipped, the size of the current log is set to 365 days, but that can be extended in the configuration file (not recommended).
The history log is identical to the current log, except that the data is 60 second intervals, and it is set to wrap at 3650 days (ten years). It could, in theory, hold about 16 years. Another key difference of the history log is that it is built from the current log, and does not have any holes. That means that access is direct and immediate. The current log can have holes, and so retrieval can be slowed by searching.
It doesn’t matter how many inputs you are using. The datalog records the state of all 15 channels in each entry.
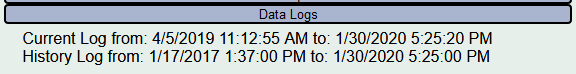
Here are my home logs. I had my current log very small for awhile to exercise the wrap logic, but I reset it’s limit and it’s now growing to a year.
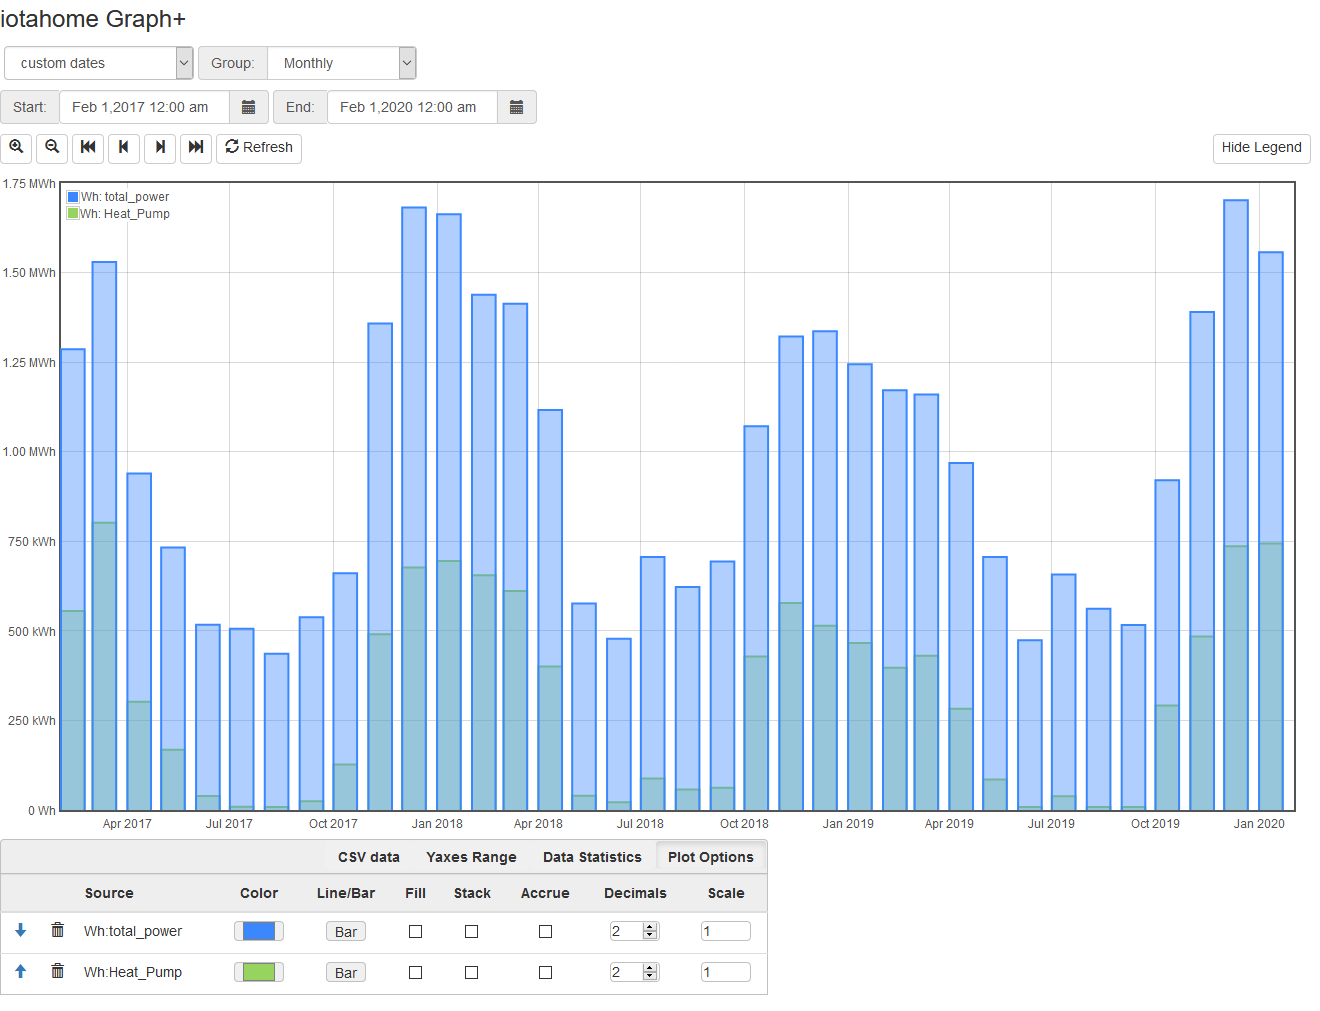
I’m happy to hear you like Graph+. The old graph program was a port from Emoncms, and while it works well with that database, it didn’t have the ability to access all of the metrics available as standard in IoTaWatt. Since Graph+, I find myself using it for everything as well.
But the underlying new query API is the real power. It paves the way for other tools that could, for instance, summarize kWh for all channels over any selected period, and compare to another period. Because of the way the datalog is structured, a query of kWh used each month of a year compared to the previous year would take less time than plotting your daily power.
Here’s my last three years. You can see how the minisplit factors into the winter usage.