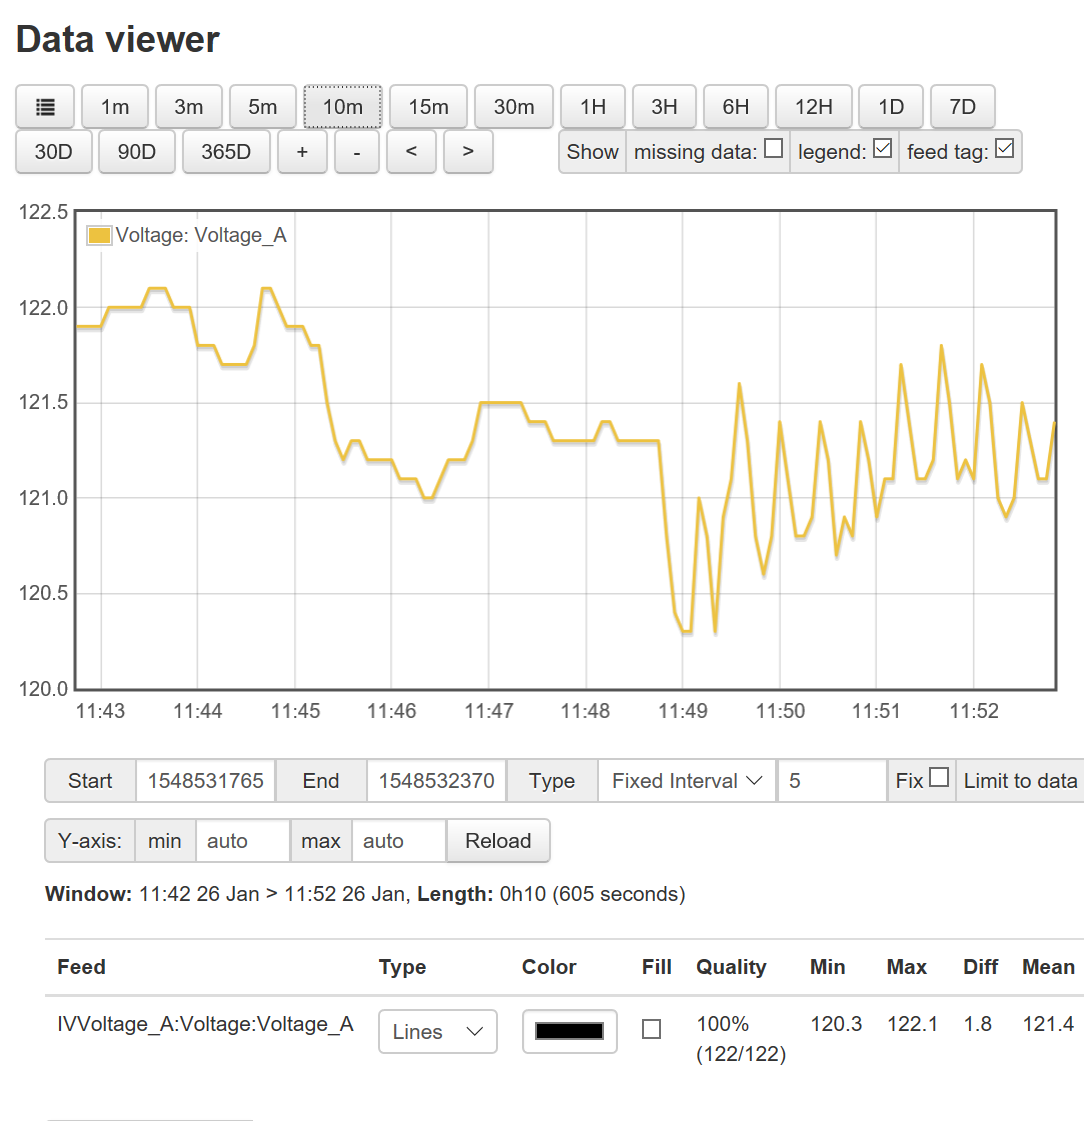
I submitted a PR for part of your request. I added more buttons and it now supports:
1m, 3m, 5m, 10m, 15m, 30m, 1H, 3H, 6H, 12H, 1D, 7D, 30D, 90D, 365D.
This is much closer to Grafana. I can look at adding the date picker, but that is a bigger change.
1 Like
I’ll take a look. Might want to change the menu to a drop down, but I like the choices.
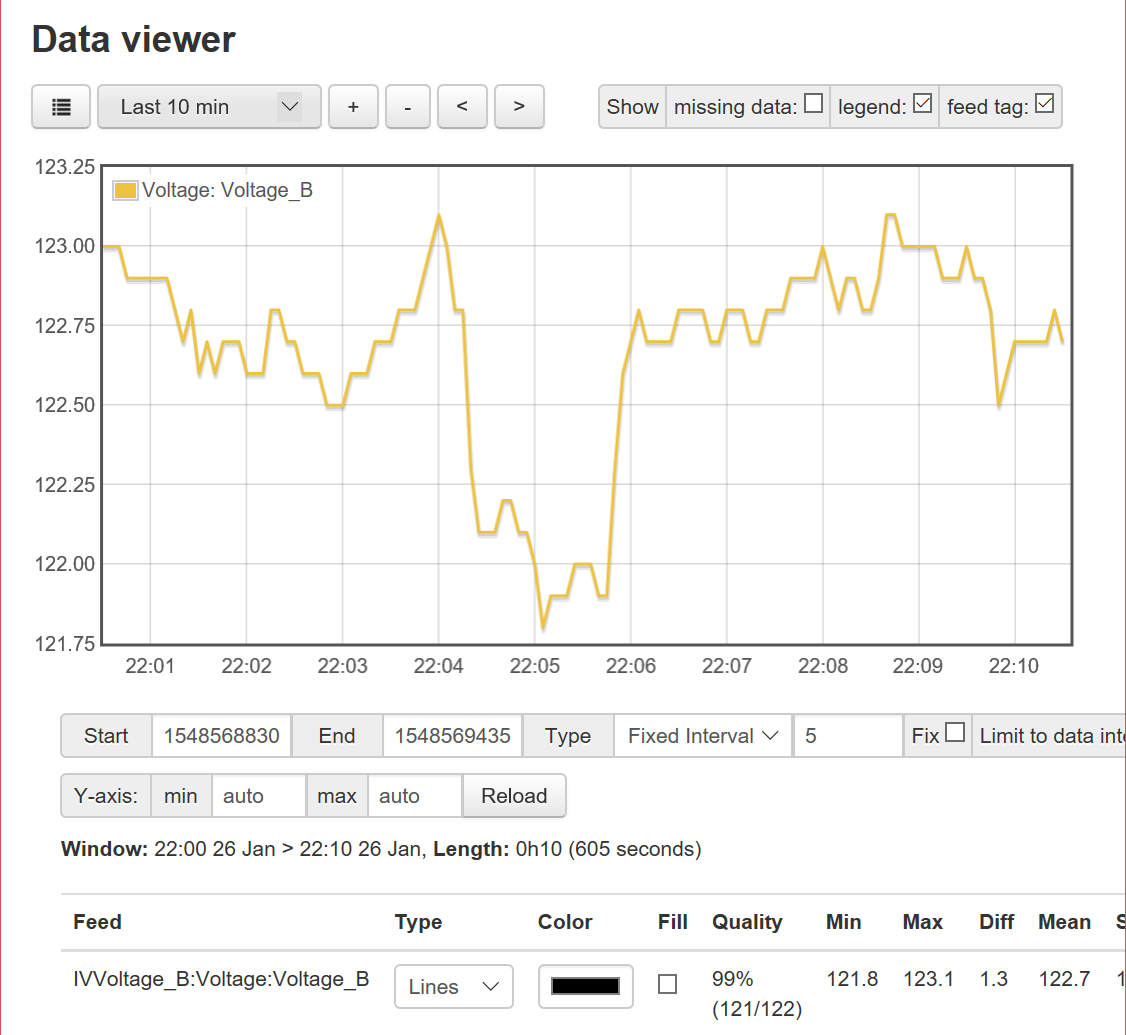
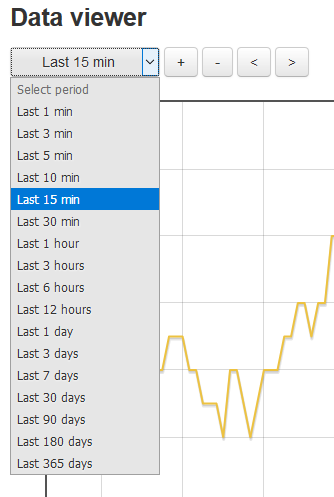
Now with a dropdown:
CSS could use improvement and perhaps JS to select the selected item (hard coded for now) and to not select something when the zoom/pan buttons are used
This module was coded by Trystan Lea at OEM. I made changes to work asynchronously with IoTaWatt, but since then, someone has made substantial changes to the version in EmonCMS. There are some new things there that I like, and others not so much, but it would be worth a look at what they did. I still need to learn JQuery. Not home today, I’ll look at it when I get back.
Thanks
Take a look now (or when you wake up, since it is very late where you are located). It now is using more proper jQuery and looks at Change on the selection and also when zooming (since the selected level would no longer be correct).
I think it looks pretty decent and I like the dropdown on both Edge and Chrome on Android. The behavior also looks good to me.
1 Like
Nice changes here, personally I’d like to see a 2nd Y-axis scale config, I could do a PR if people are interested.
Btw how are you testing these changes? I’ve tweaked the code so I can run the graphs on my dev machine talking to the api on my real iotawatt… I can share again if that’s interesting…
Cheers
Tim
I do all development of these apps using the ACE editor directly in the IoTaWatt file manager. It’s a good editor and I can save the edited file directly to the SD and run it. I’ve never used a different development environment for this or the config app as doing it directly on the IoTaWatt is so easy.
On the second Y axis scale, perhaps it could only appear under the first when the right axis is used? Itwould be nice if someone comes across a way to designate if a plot is right or left in the legend.
I’ve got a list of things I’d like to add to the graphing capabilities, whether using this framework or something new. I think pie charts that show usage breakdown would be a nice addition, although it will require some clever design to specify the data that is to represented as the parts and whole.
I used Visual Studio Code to edit the files on my copy of the repo from GitHub. I then use the upload function to upload the new copy. I learned that even with bad changes (as long as it was not the editor) I could just upload a new copy. I was not able to figure out how to use the editor to save a copy, but VS Code is much nicer for editing, so I didn’t try too hard.
I agree on the 2nd Y axis scale. I really don’t like the scaling much, but having the ability to have them be independent would be much better.
I also have a change for adding the name to the main page. Since I have two it makes it easier to see which one is which. Need to add that to the graph page.
I took a quick look at the legend but didn’t see the code where it is actually used, so maybe the graphing code is in one of the downloaded JS files.
1 Like
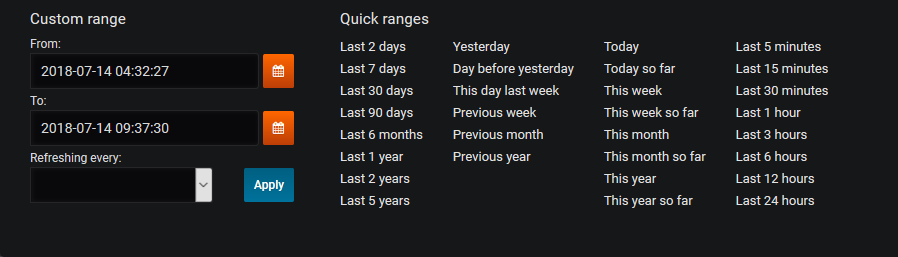
This is a nice improvement. I think we would all like to get to something with more choices as in the selection box on grafana:
But perfect is the enemy of good, and frankly, I don’t have much experience with accepting PRs and appreciate going slow. That said, and not being very good at JQuery, it looks like @frogmore has done a good job coding this in. I’m inclined to accept the PR as is and expect more improvements to follow. But first, I’d like to get some feedback from other users. So here are the two files that were modified.
graph.htm (16.1 KB)
graph.js (36.2 KB)
To use them, just download and then upload to your IoTaWatt. You might want to download the existing versions first so you can revert easily if you have a problem.
I know there will be a lot of suggestions of how to improve it further, but lets segregate that out and if anyone wants to start a thread about further improvements to Graph, and I’ve got some suggestions too, please start a new thread. This will be about testing and evaluating this single change.
I had never used jQuery before and haven’t really done HTML or JavaScript for about a couple of decades, so I am sure there are things that can be improved. The existing code is a mix of styles and uses different (but compatible) frameworks. In the web world there are usually at least 17 ways to do something, with many of them being fine. I don’t have a wide selection of browsers, but I did make sure it worked at least pretty well on the ones that I use regularly (still need to make it work on my very old and obsolete Surface 2).
I use Grafana, so I did follow the easy part of what they did. They have some other choices that are nice, but I find I mostly use the some time back from now. It is possible to allow more configuration options for intervals, but that is only really helpful on mobile devices. With a mouse it is really easy to zoom in to the point of interest.
Yesterday, Day before yesterday, and the like require setting both the start and end times. Currently the code always uses now for the end time, so it would be a bigger change to enable those options. The other thing I like is setting from to now-6d. That would be nice, so I will probably spend some time thinking about how to implement it.
1 Like
I’m a full time web developer, I’ve worked with Jquery a few years ago, these days mainly doing Aurelia apps on the frontend with NodeJS at the backend.
I can work on a few improvements. I have a PR ready to send to add the 2nd axis config if you want to take a look.
How do you want to manage these changes? Raise and discuss issues in github or something else?
1 Like
I believe @overeasy wanted to have a new post in this forum to discuss any further improvements and to keep this post focused on the current set of improvements that I submitted with a PR. I haven’t heard any negative comments about the changes I made, but I don’t know how many people have looked at them or tried them out.
I like the idea of the 2nd axis config, so please start a new thread with that. I want to see it.
I’ve looked at your PR, looks good to me.