I’ve spent the last week setting up my system and putting together an influx/grafana docker setup. Mostly happy, but there’s a couple of issues I haven’t been able to solve on my own.
First is a simple one (I think). My understanding is that upon setting up a new influx upload, I should be able to send historical data to the database, so that if, say, in the future, I had to re-do my influx system, I would be able to fill it with all the old data still held on the iotawatt. I’ve set the history field to the 17th, but my influx database only has data from the moment I put it online. Not sure what I’m missing there?
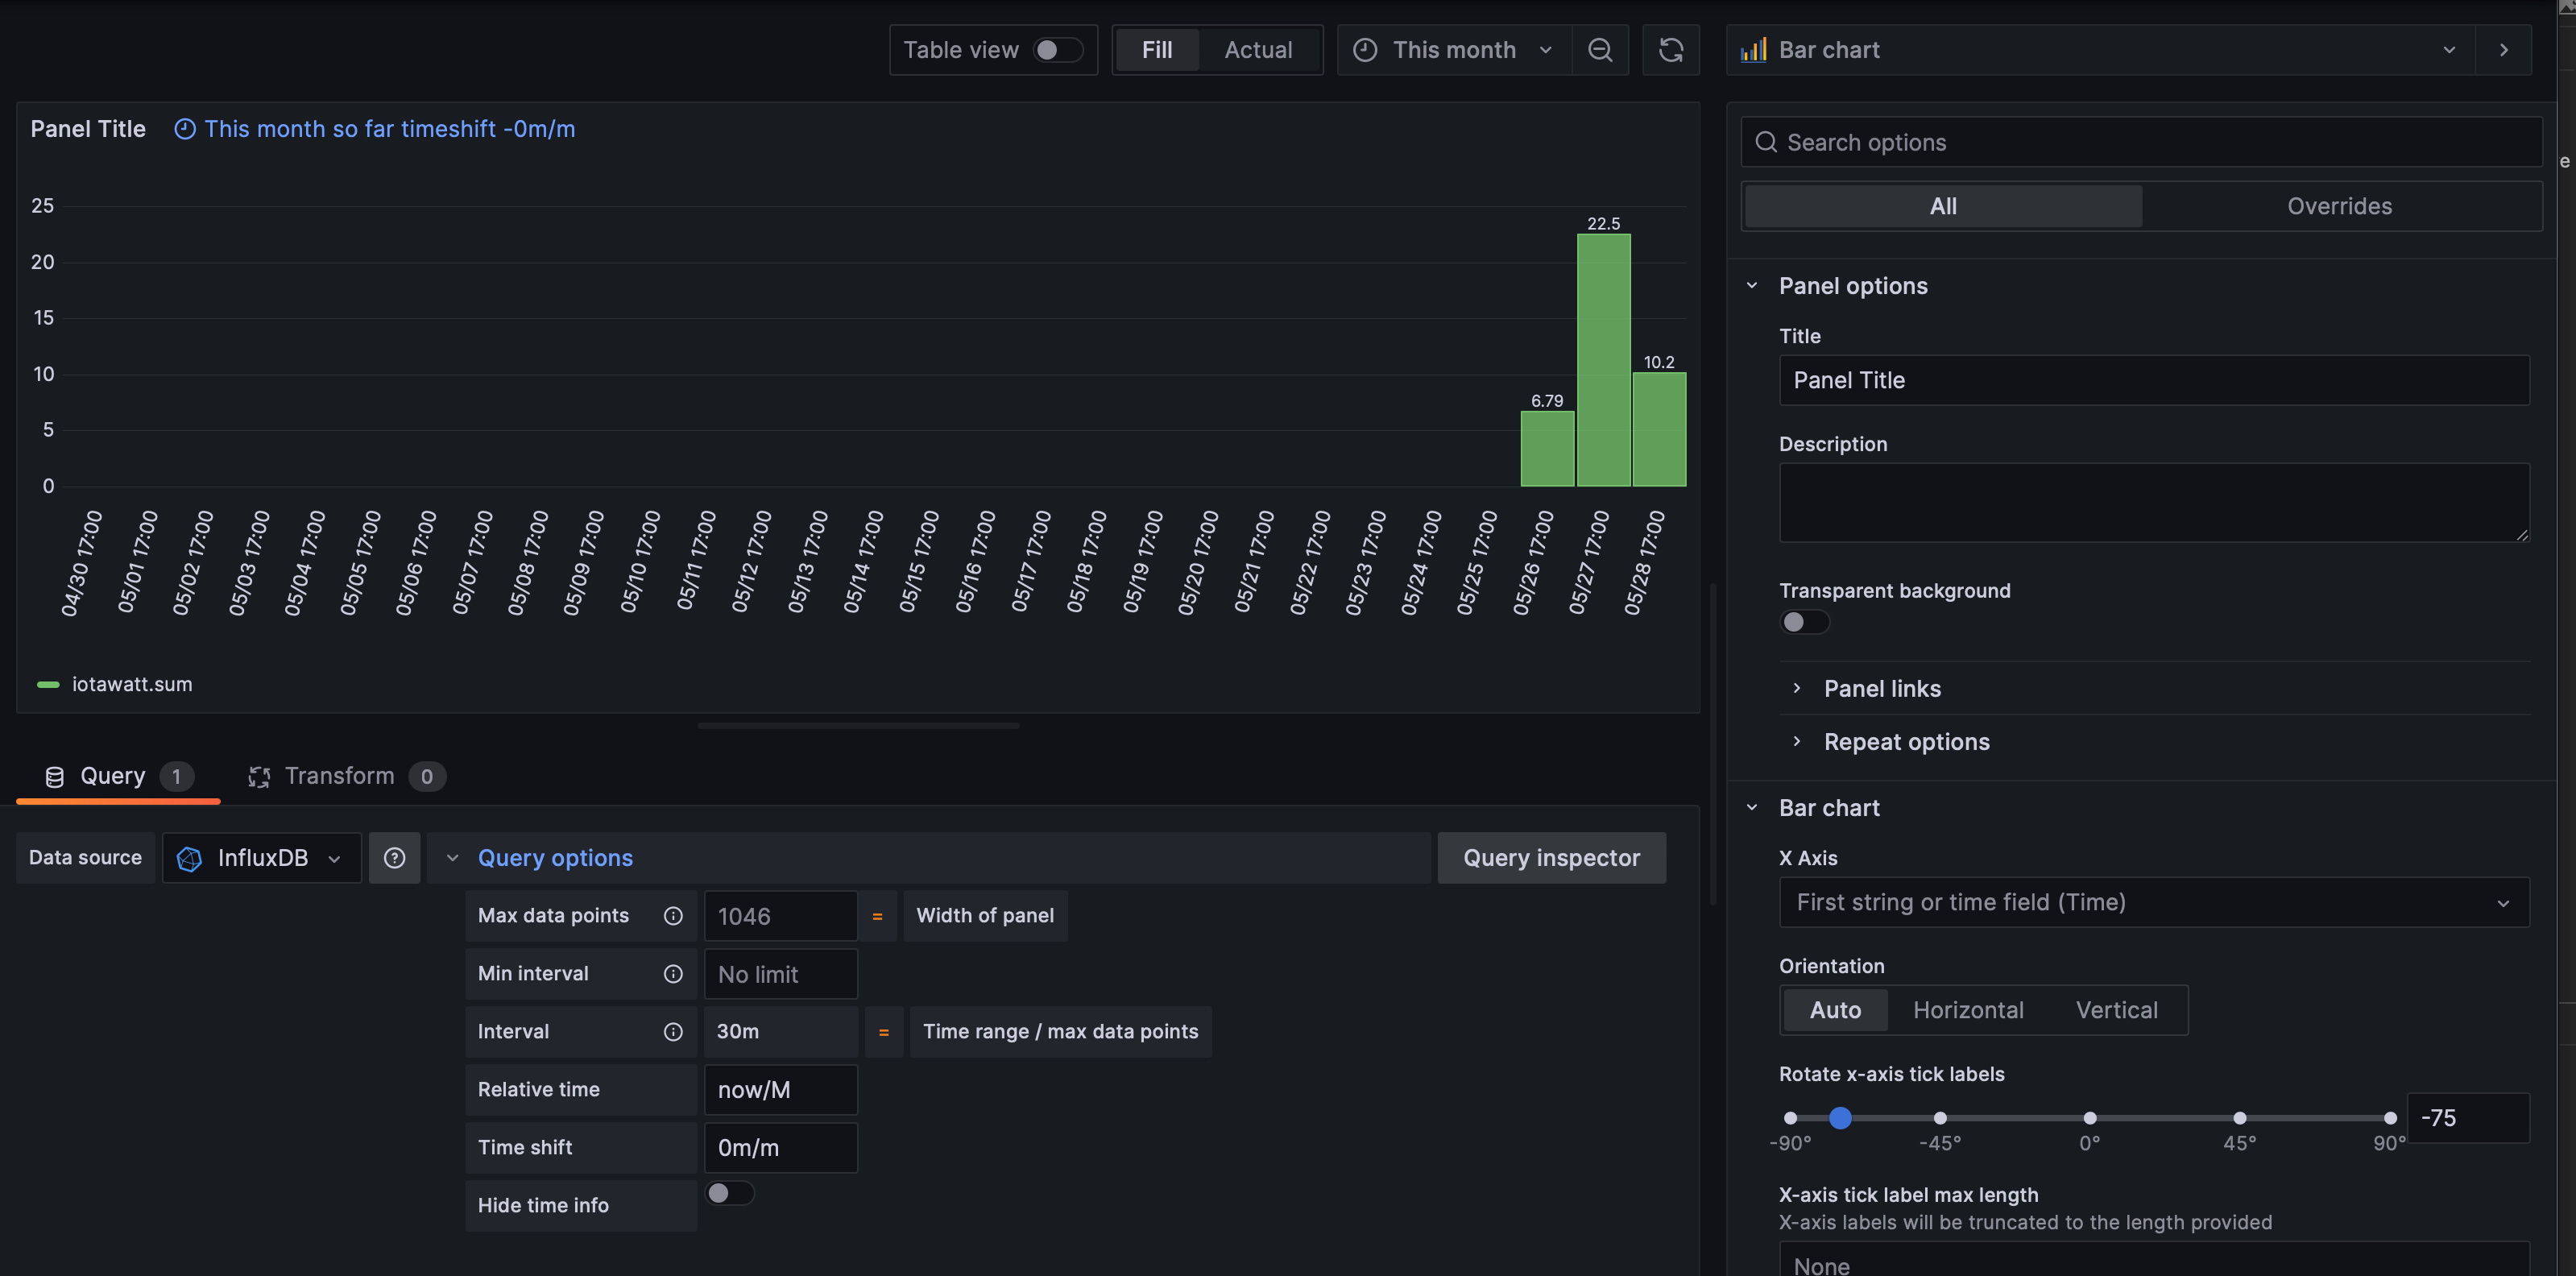
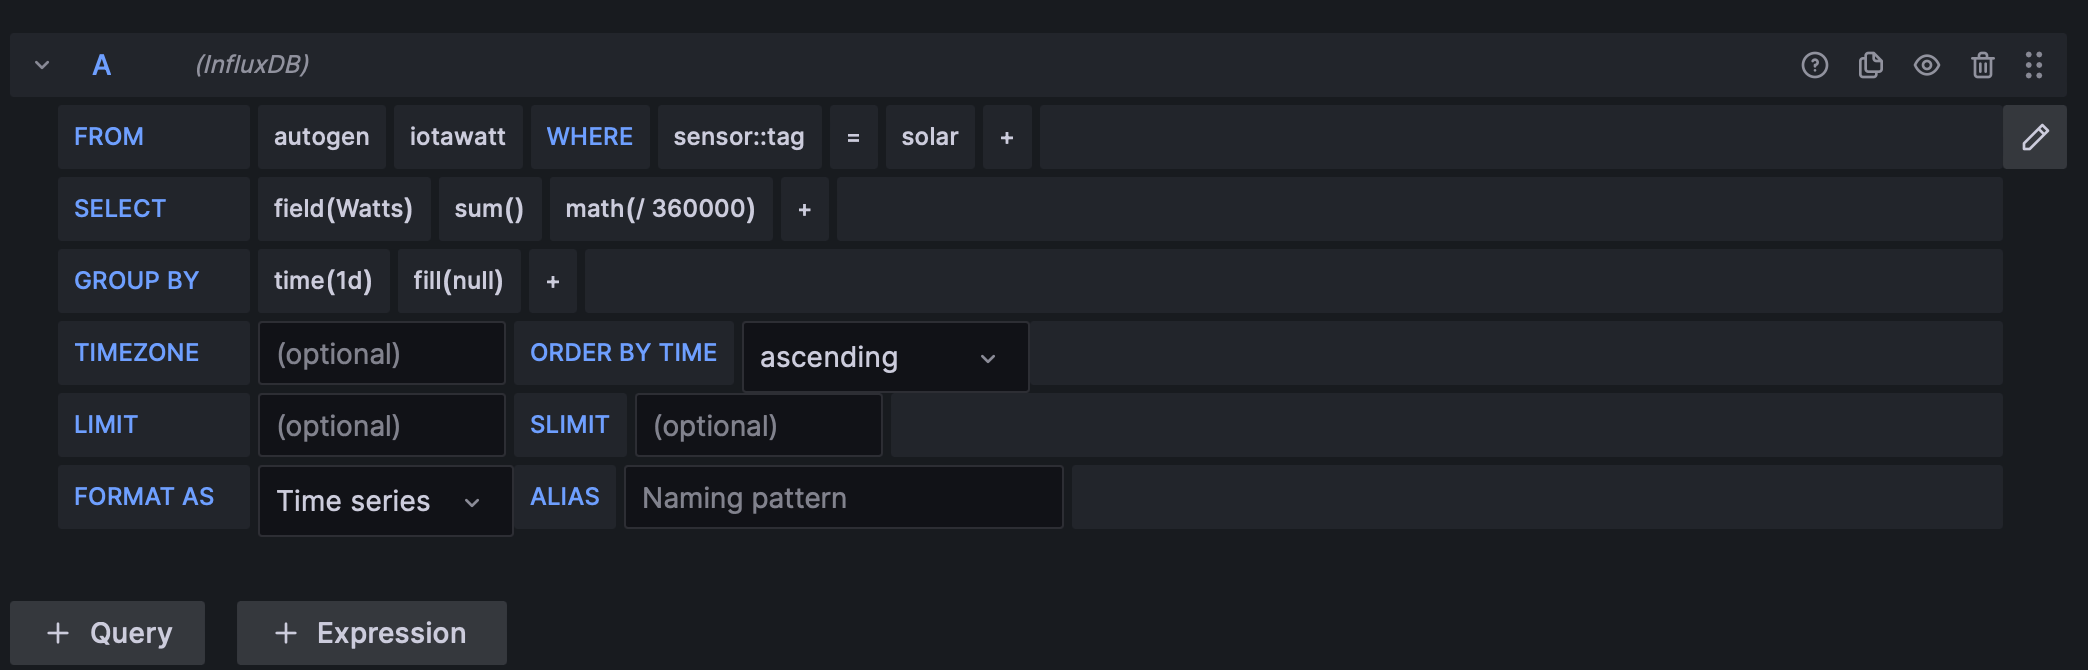
The second issue is I can’t for the life of me create bar graphs in grafana to graph kwh totals per day (in a monthly view), and kwh per month (in a yearly view). For some reason, the conversion from watts to kwh that I’ve used on my other panels doesn’t produce the right numbers in the bar graph. Here’s what I’ve setup:
If I put the timescale to “today,” it gives the correct number in a single bar. But on the monthly timescale, it doesn’t even show a number for today’s date (5-29). Weirdly, influx doesn’t actually have data on the 5-26, but it’s showing a number there on the graph. The numbers for the previous dates should be:
5-27=11kwh
5-28=19.7Kwh
Yes, Iotawatt keeps history and is supposed to send the old data. But, the way it does it is a little tricky to get right. You have to set the oldest date you want to send before you start sending any data at all to a config. My guess is that you set the date to an older date after it had already started uploading data, so that is as far back as the data goes.
For the second issue, I think you have two problems. First I don’t think you can get get KWH from Watts with the math you are doing. KWH are power integrated over time to yield energy. You appear to be adding power over time trying to get energy. This will work if all your samples are consistent AND you do the math right. Most people just use the Influx integral() function. Having said that, it will give you problems over long periods, since it is computationally expensive and there is a LOT of data in a day, let alone a week or month. This is the reason people use continuous queries to generate energy from power values.
The other issue you are likely seeing is the difference in timezones. InfluxDB is integrating on days based on UTC. You likely prefer one of the 23+ other choices.
Here is an example InfluxDB 1.x query that shows the use of “tz” to set the time zone.
SELECT difference(last("water")) / 100 FROM "sensor" WHERE ("NodeName" = 'wifi8' AND "id"='74468833') AND $timeFilter GROUP BY time(1d) fill(null) tz('America/Vancouver')
Note that this particular query is from a measurement that shows the total usage (water meter), so the math is simple.
You might also want to consider switching to InfluxDB 2.x. They are already working on 3.x and the 2.x OSS server supports queries in both InfluxDB and Flux. Flux has a lot more powerful queries. But with that power comes a lot of responsibility. That is why it is great it supports both. The nice thing about 2.x is that it has much better UI, ie it actually has a UI (as opposed to the nothing that comes with 1.8.
I have three different InfluxDB server instances: 1.8, an early 2.x, and a newer 2.x. I like the newest one the best, and am in the process of moving everything over to it.
1 Like
Thank you so much! Somehow missed the time zone issue. That fixed it. I’ve already got a pair of continuous queries going, so my plan is to just use them for the fixed long term graphs for monthly and annual usage, as I don’t ever plan to set the dashboard time beyond a few days.
Beyond the UI, is there anything I’m missing in terms of stability etc with not migrating to 2.0? I don’t see myself using influx for much beyond iotwatt, but I do have a second box coming for my sub panel, and I’d rather set it all up “right.” Doesn’t look like too much of a hassle to upgrade my existing install so maybe I’ll roll the dice.
If you never touch the database and never want to make new queries, it probably doesn’t matter. While I have been doing that for years with one of mine, it is a recipe for NOT success. How long it takes for the not part to kick in will vary. Any time you are using software, you should have a maintenance plan. That includes regular updates. All development appears to have stopped on the 1.x branch. There have been 8 big releases in the 2.x branch.
Most people complain about the lack of an auto query builder in Grafana. That is true, but there are two solutions now. Use the 1.x interface in Grafana or use the Flux query builder in the InfluxDB UI.
If your needs are simple and you don’t want to invest in learning more, stick with 1.8. It will probably continue working for years. Otherwise, make the jump, now or at the next maintenance window.
1 Like
So my wife got covid, and we’re now stuck on vacation in isolation. Figured it’s the perfect time to mess around with migrating to V2!
Going to start by just replicating the V1 setup to my existing dashboard but with V2, then I can muck around with some of the unique V2 features (specifically want to create an annual bar graph with usage grouped by calendar month).