does anyone have sample grafana dashboards to share for the InfluxDB2 (Flux) uploader? This is my first time using flux. I have the historical wattage queries down fine, but im trying to aggregate to kWH in flux and no clue how. I was able to do this with other non iotawatt devices in the old influx/grafana query
builders. I couldnt find a ton on google or the forum for flux examples.Sending updates every 10 seconds if it matters.
What im really trying to accomplish is have the kWH calculated based on range selected. If i choose last 24hour than the range would do that. If i select last 7 days, than range would do that, etc.
If this doesn’t work, would i be advised to roll back to older influx where im a bit more comfortable?
Also @overeasy, would you have any plans to add output to prometheus? Running influx in a docker is pretty trival for me, but i have moved all my stuff in the past that went to influx, to prometheus instead and seen huge performance improvements.
To calculate kWh in a given period of time we just add this at the end of our query:
|> integral(unit: 1000h, column: "_value")
Also, in the aggregateWindow function we usually set the value in every to match the updates from the IW, in your case it would be 10s.
2 Likes
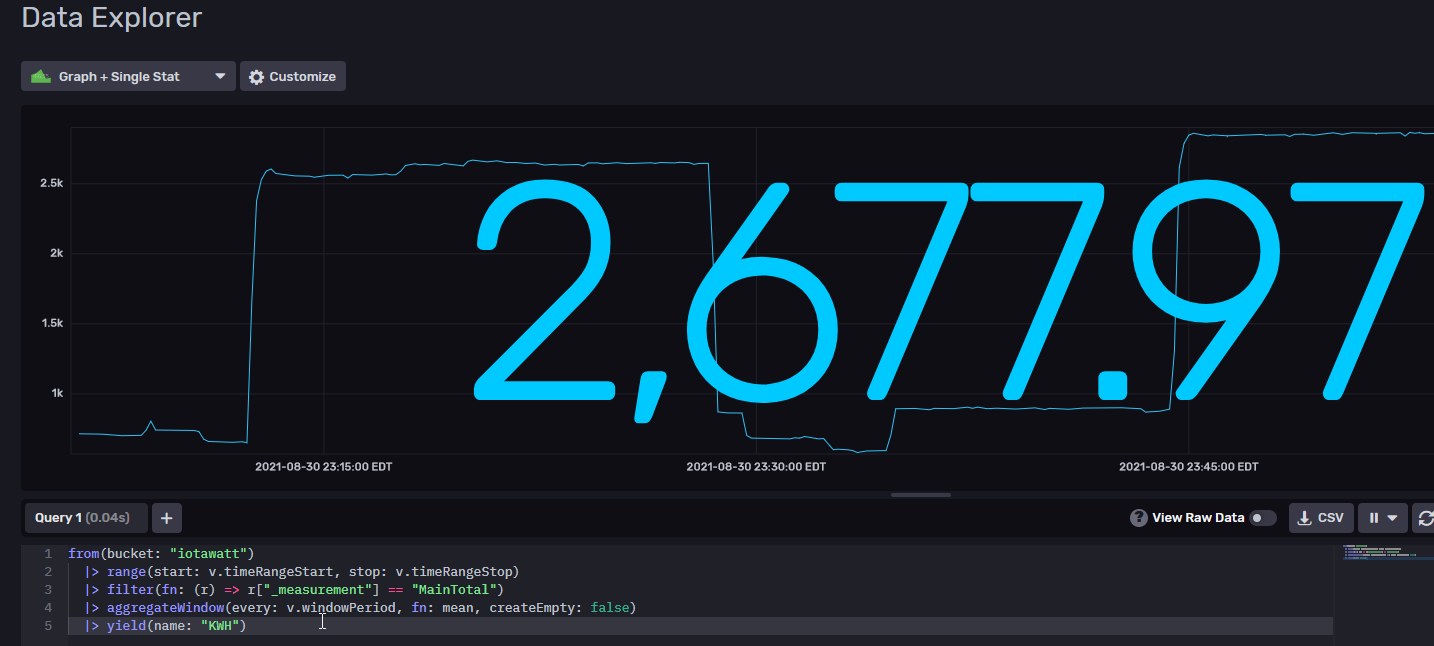
Well that was easy (hardly ever just one line of code  ). the one line at the end got my KWH in my filtered range. Rather than do this for each device, any clue how to make it get all the unique “measurements”. I want to make a pie chart as well as a table view.
So whats the point of the aggregate window function. When i changed it i got an error. " ```
compilation failed: error at @4:6-4:78: expected comma in property list, got DURATION
    from(bucket: "iotawatt")

      |> range(start: v.timeRangeStart, stop: v.timeRangeStop)

      |> filter(fn: (r) => r["_measurement"] == "MainTotal")

      |> aggregateWindow(every 10s: v.windowPeriod, fn: mean, createEmpty: false)

      |> integral(unit: 1000h, column: "_value")
Instead of v.windowPeriod set the update time, 10s. Sorry, I guess my explanation wasn’t clear enough. The point is to have as many data points in your functions as the IW sends to the database, Influx varies the number of data points depending on your time window, be it 1 hour or 7 days.
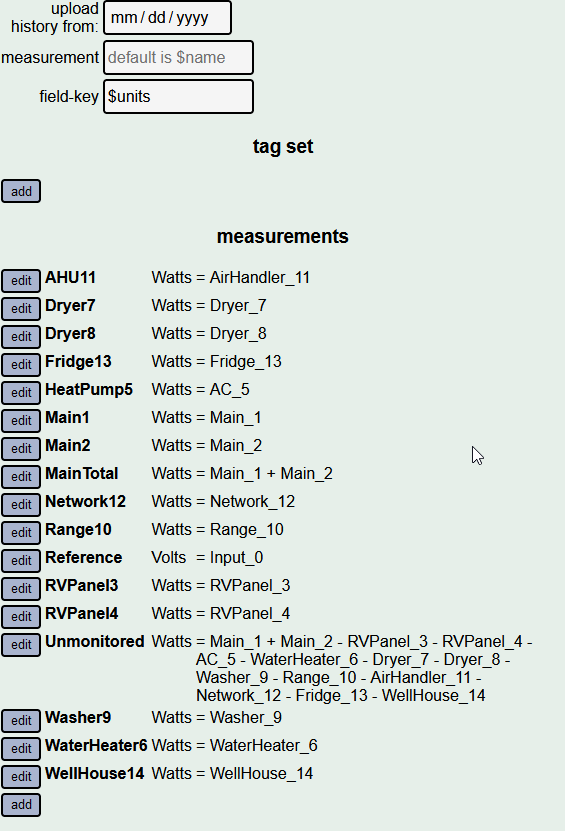
About the unique measurements I’m guessing that you are talking about each input in the IW sensor, so to do that we usually add a units filter in Flux so it shows all the measurements that are sent in Watts.
Here is an example of the query we use to calculate de energy consumption in each input at any given period of time. We add more tag values to filter through the sensors we have installed. When you run this function, Influx returns a table with all the kWh values of all the inputs.
from(bucket: "{bucket}")
        |> range(start: {ins}, stop: {des})
        |> filter(fn: (r) => r["Cliente"] == "{nombre}")
        |> filter(fn: (r) => r["IotaWatt"] == "{IW}")
        |> filter(fn: (r) => r["Units"] == "Watts")
        |> aggregateWindow(every: 5s, fn: mean, createEmpty: false)
        |> integral(unit: 1000h, column: "_value")
1 Like
I too would appreciate anyone else’s grafana examples with influxdb 2. The energy panel work on Home Assistant is exciting - but I’d also like to visualize my data in grafana as well.
I am have just converted over to the new influx v2 setup and have normal line graphs working but when trying to do a status calculation the calculation is just adding the output as it comes through, hence 20kw + for what is really a couple of kw usage a day.
I have trying to read up all day on different forums but to be honest experienced enough to always understand how to adapt to this situation.
from(bucket: “iotawatt”)
|> range(start: v.timeRangeStart, stop: v.timeRangeStop)
|> filter(fn: (r) => r["_measurement"] == “Office”)
|> filter(fn: (r) => r["_field"] == “value”)
|> aggregateWindow(every: v.windowPeriod, fn: mean, createEmpty: false)
|> yield(name: “mean”)
I did try the above suggestion but I don’t understand how to adapt it properly
I tried the updated version too
from(bucket: “iotawatt”)
|> range(start: v.timeRangeStart, stop: v.timeRangeStop)
|> filter(fn: (r) => r["_measurement"] == “Office”)
|> filter(fn: (r) => r["_field"] == “value”)
|> aggregateWindow(every: 10s, fn: mean, createEmpty: false)
|> integral(unit: 1000h, column: “_value”)
But now to 1.67w for the day. I was using today so far being almost 21hrs
I don’t understand your problem very well, but when you use that line of code the units of your result would be in kWh, not W as you state in your post. So in that day the equipments you used in “Office” consumed 1.67 kWh in total, seems kind of normal to me.
You are completely right, I just had Watts as my measurement on the side rather than kwh, once changed all corrected as you said.
Thanks
1 Like
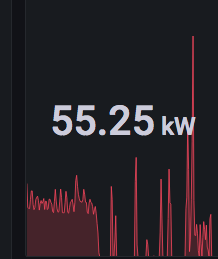
How can I get an accrue graph like what the iotawatt provides? I feel like following is very close but I’m only able to get the integral for the time range, not a graph.
from(bucket: "power")
  |> range(start: v.timeRangeStart, stop: v.timeRangeStop)
  |> filter(fn: (r) => r["_measurement"] == "Watts")
  |> filter(fn: (r) => r["_field"] == "ctc_ac_compr")
  |> aggregateWindow(every: v.windowPeriod, fn: mean, createEmpty: false)
  |> integral(unit: 1000h, column: "_value")
What I want is the green graph below:
Late reply, but I was struggling with the same question
I think you need to put the integral in the aggregateWindow
from(bucket: "iotawatt")
  |> range(start: v.timeRangeStart, stop: v.timeRangeStop)
  |> filter(fn: (r) => r["_measurement"] == "usage")
  |> filter(fn: (r) => r["_field"] == "value")
  |> aggregateWindow(
     every: 1h,
     fn: (tables=<-, column) =>
      tables
        |> integral(unit: 1h)
        |> map(fn: (r) => ({ r with _value: r._value / 1000.0}))
    )
Credit to this reddit post