What is everyone using for your influxdb post intervals?
For years I’ve been using 5s, with a 2 year data retention policy. Way overkill. I started noticing my influx server would take forever to start then realized how much data I was hording. 
My use case is just to look at graphs in grafana. I like seeing the spike as the compressor on the refrigerator kicks on, details like that.
I just bumped up to 20s posts and didn’t really notice any lack of detail. So I’m curious how high I can go without loosing detail. Some data would be nice to hang onto for a couple years, like comparing AC and solar from year to year.
The way the IoTaWatt datalogs work is that the most recent year is 5 second and older data is one minute. You can come up with your down sample strategy to be able to see details of recent events but have kWh for historical usage year to year or so.
1 Like
I leave mine running all the time, so haven’t noticed start time, or did you mean query time with Grafana?
What are you using for your server hardware (perhaps an underpowered rpi)?
I use a real PC with a real CPU, at least decent laptop from less than a decade ago and have great results. It idles at less than 10W (some as low as 2-4W with screen off) but can go to 30-40W if necessary.
I looked and I have been sending 5s data from 2 IotaWatts for years. I have not yet set up a continuous query to calculate energy, so my one dashboard that looks back 6 months or more to find peak usage can time out on some of the graphs. But the ones that are more reasonable are ready in a second or so.
Only you can decide what resolution you need. It all depends on what you want to be able to see. You can limit the resolution in Grafana to see what it would look like. If you are mostly interested in energy usage, hourly is probably fine. I use the data to troubleshoot issues so finer resolution is helpful for some issues. The other day I was trying to figure out if one of the heated buckets was working, for that more time resolution is helpful, but 30s would be fine.
Yeah, I’m referring to how often I send data from iotawatt to influx. My iotawatt influx database was over 2gb. (On linux if you are curious du -h --max-depth=1 /var/lib/influxdb/data ) The database being that big, takes awhile for the server to start. Longer than the ubuntu autostart process allows by default.
I was sending every 5 seconds, but changed it to 20 seconds and still seem to get decent graphs which should use significantly less storage. Just wasn’t sure if I could get away with going higher, and if I’d lose more granularity.
Yes and yes. Only you can decide what you need. Most people get monthly granularity from the power company. For energy usage daily is probably enough most of the time. You can always look at IotaWatt directly for details over the last year.
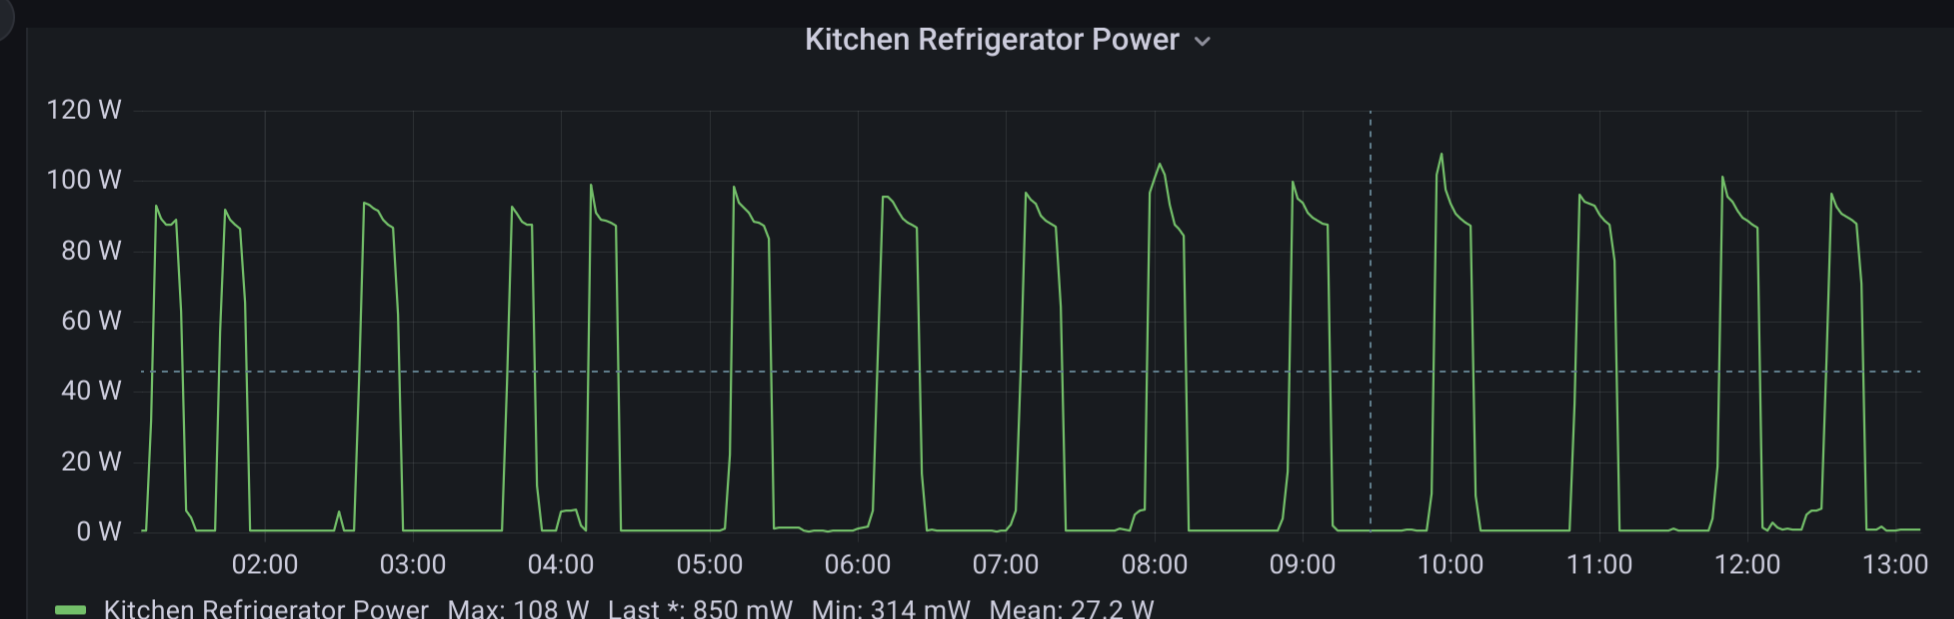
I’m not talking consumption (kwh) I’m fine with even hourly for that. But stuff like this. This is my refrigerator over the past 12 hours. I look at this graph with other branch circuits every couple days. That was actually how I knew my old fridge was on the way out. It was running longer and longer when it would cycle on.
If I only upload every minute for example, I’ll only have a data point every minute to graph.
So far it seems like 20-30s is the sweet spot for my needs…
That graph is available in IotaWatt with 5s resolution for a year back. If you NEED it in InfluxDB Grafana only you can decide what resolution you need. I use 30s for most things as it is easy and generally good enough for most investigations.
Grafana determines the resolution it asks for based on the size of the window (number of data points) and the time period. A 12 hour window has a resolution of about 30s, but can go to 15s when I have it full screen. This can give you a way to see the impact of lower resolution data. You can set the minimum interval on the Query options UI. Set it to 10 min and see what that does, to get an idea what works for you. At 12 hours 30s is fine. At 3 hours, I like more resolution, but probably don’t really need it.
My server has lots of disk space and has no problem handling all the data I send it.
Gotcha. Thanks.
I’m embarrassed to admit I’ve never messed with the default query interval in Grafana. For the most part I’m viewing graphs like that at a 24 or 48 hour window unless I’m narrowing something down. Sounds like 30s uploads from iotawatt would be fine for what I’m looking at.
Want vs need. I’m just OCD and have dashboards for everything. 
I’ll usually scan thru them in the morning when I look at my cameras too. Last year in figured my refrigerator was on its way out by graphing it’s power. Was noticing it running longer and longer, and taking longer to cool. (Smart sensor inside getting graphed too)