Influxdb update slower on one vs the other

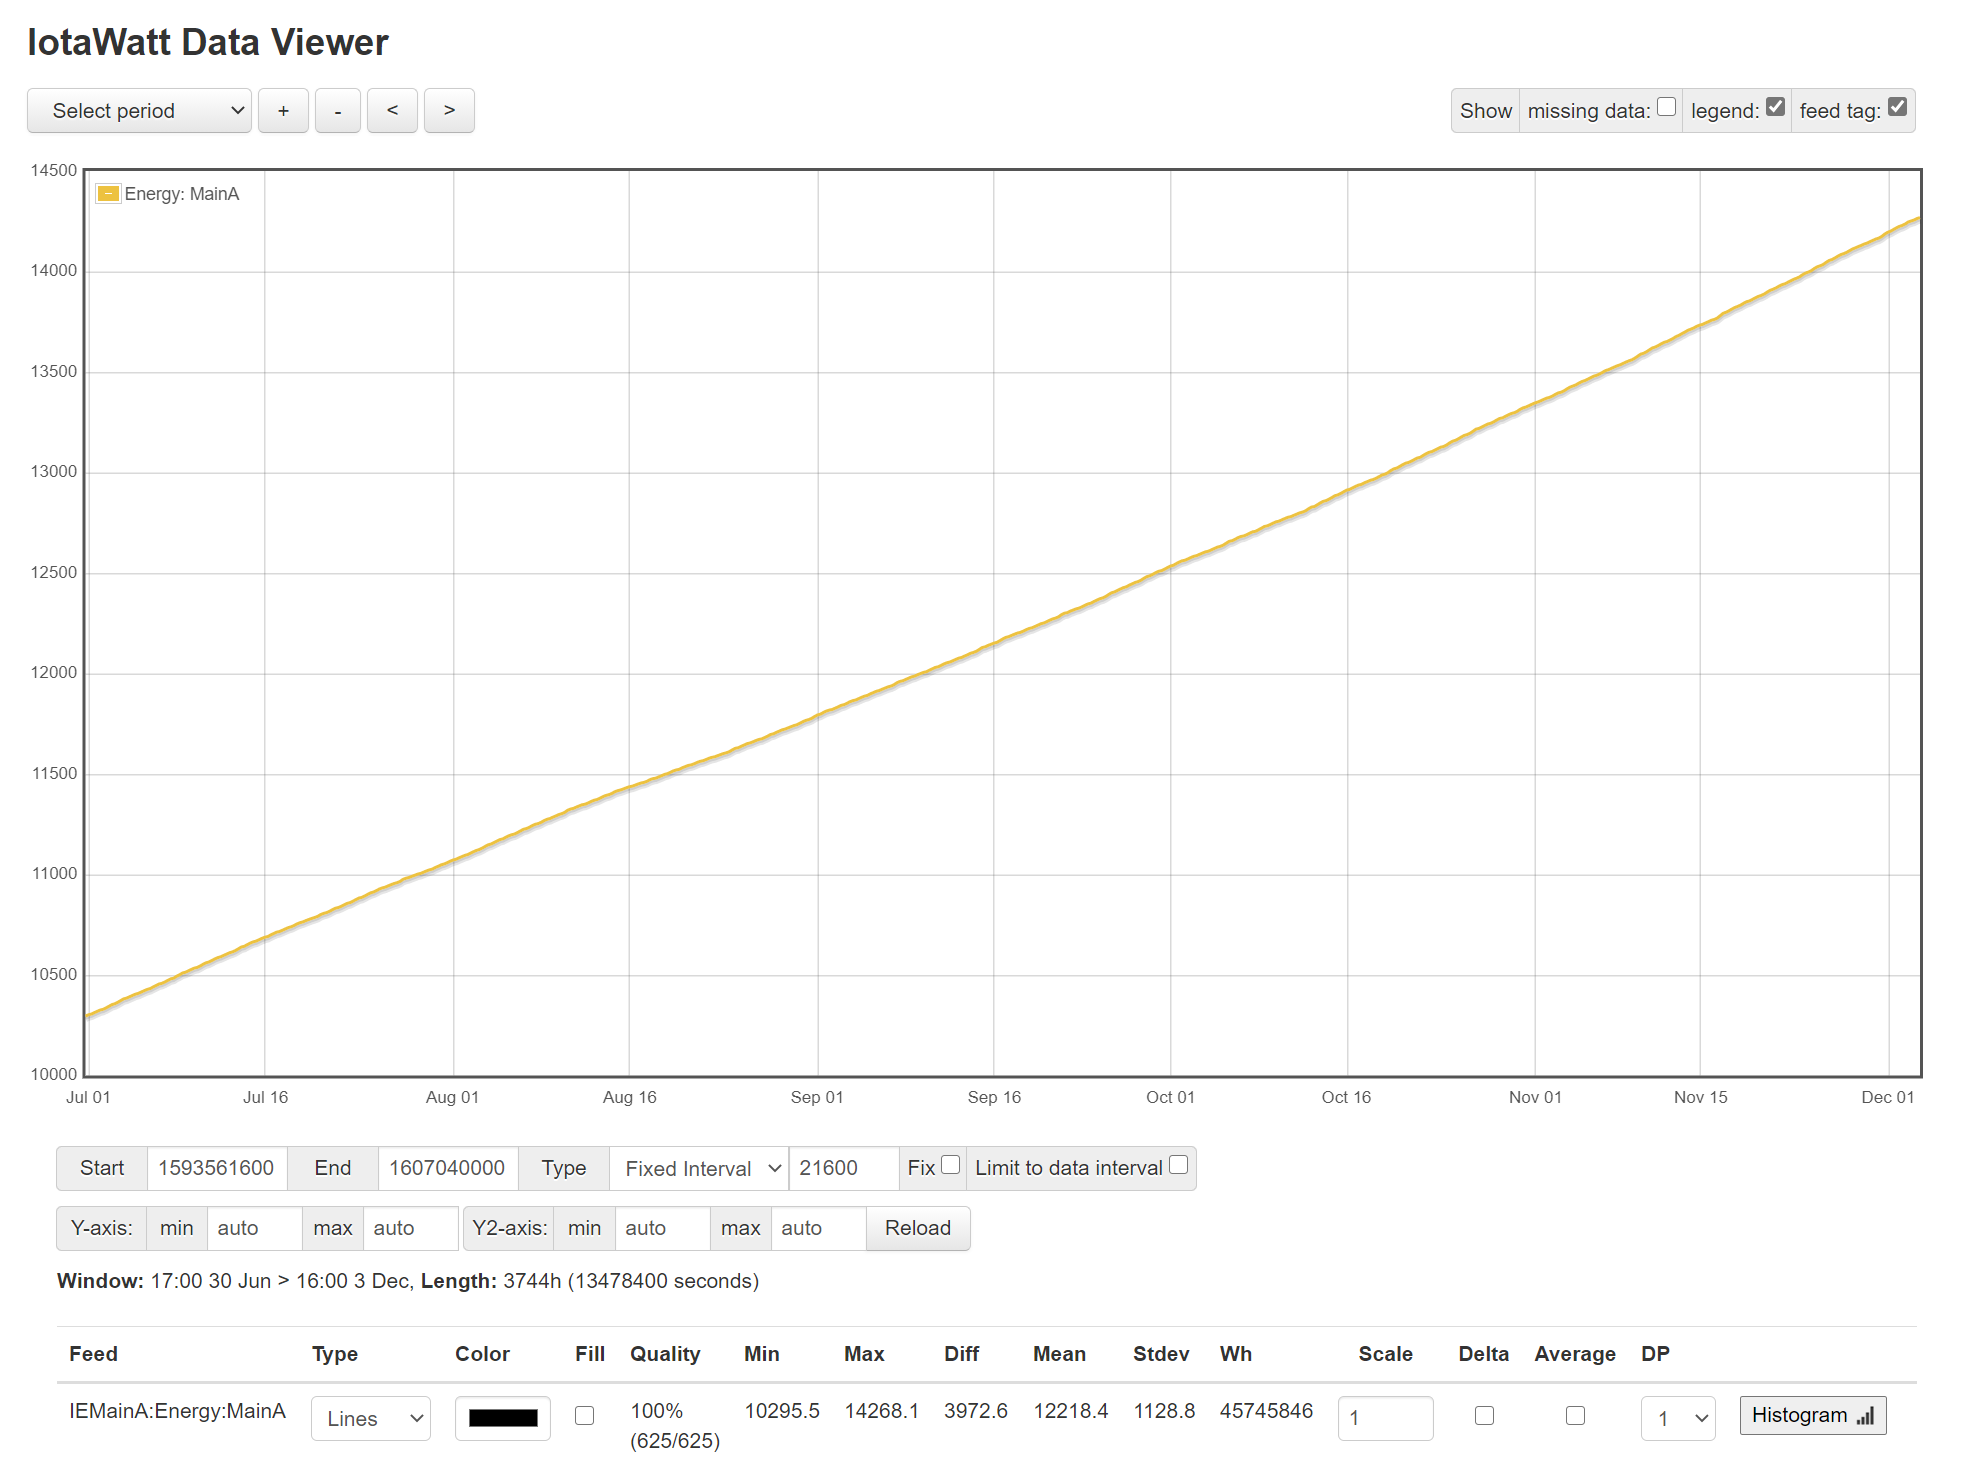
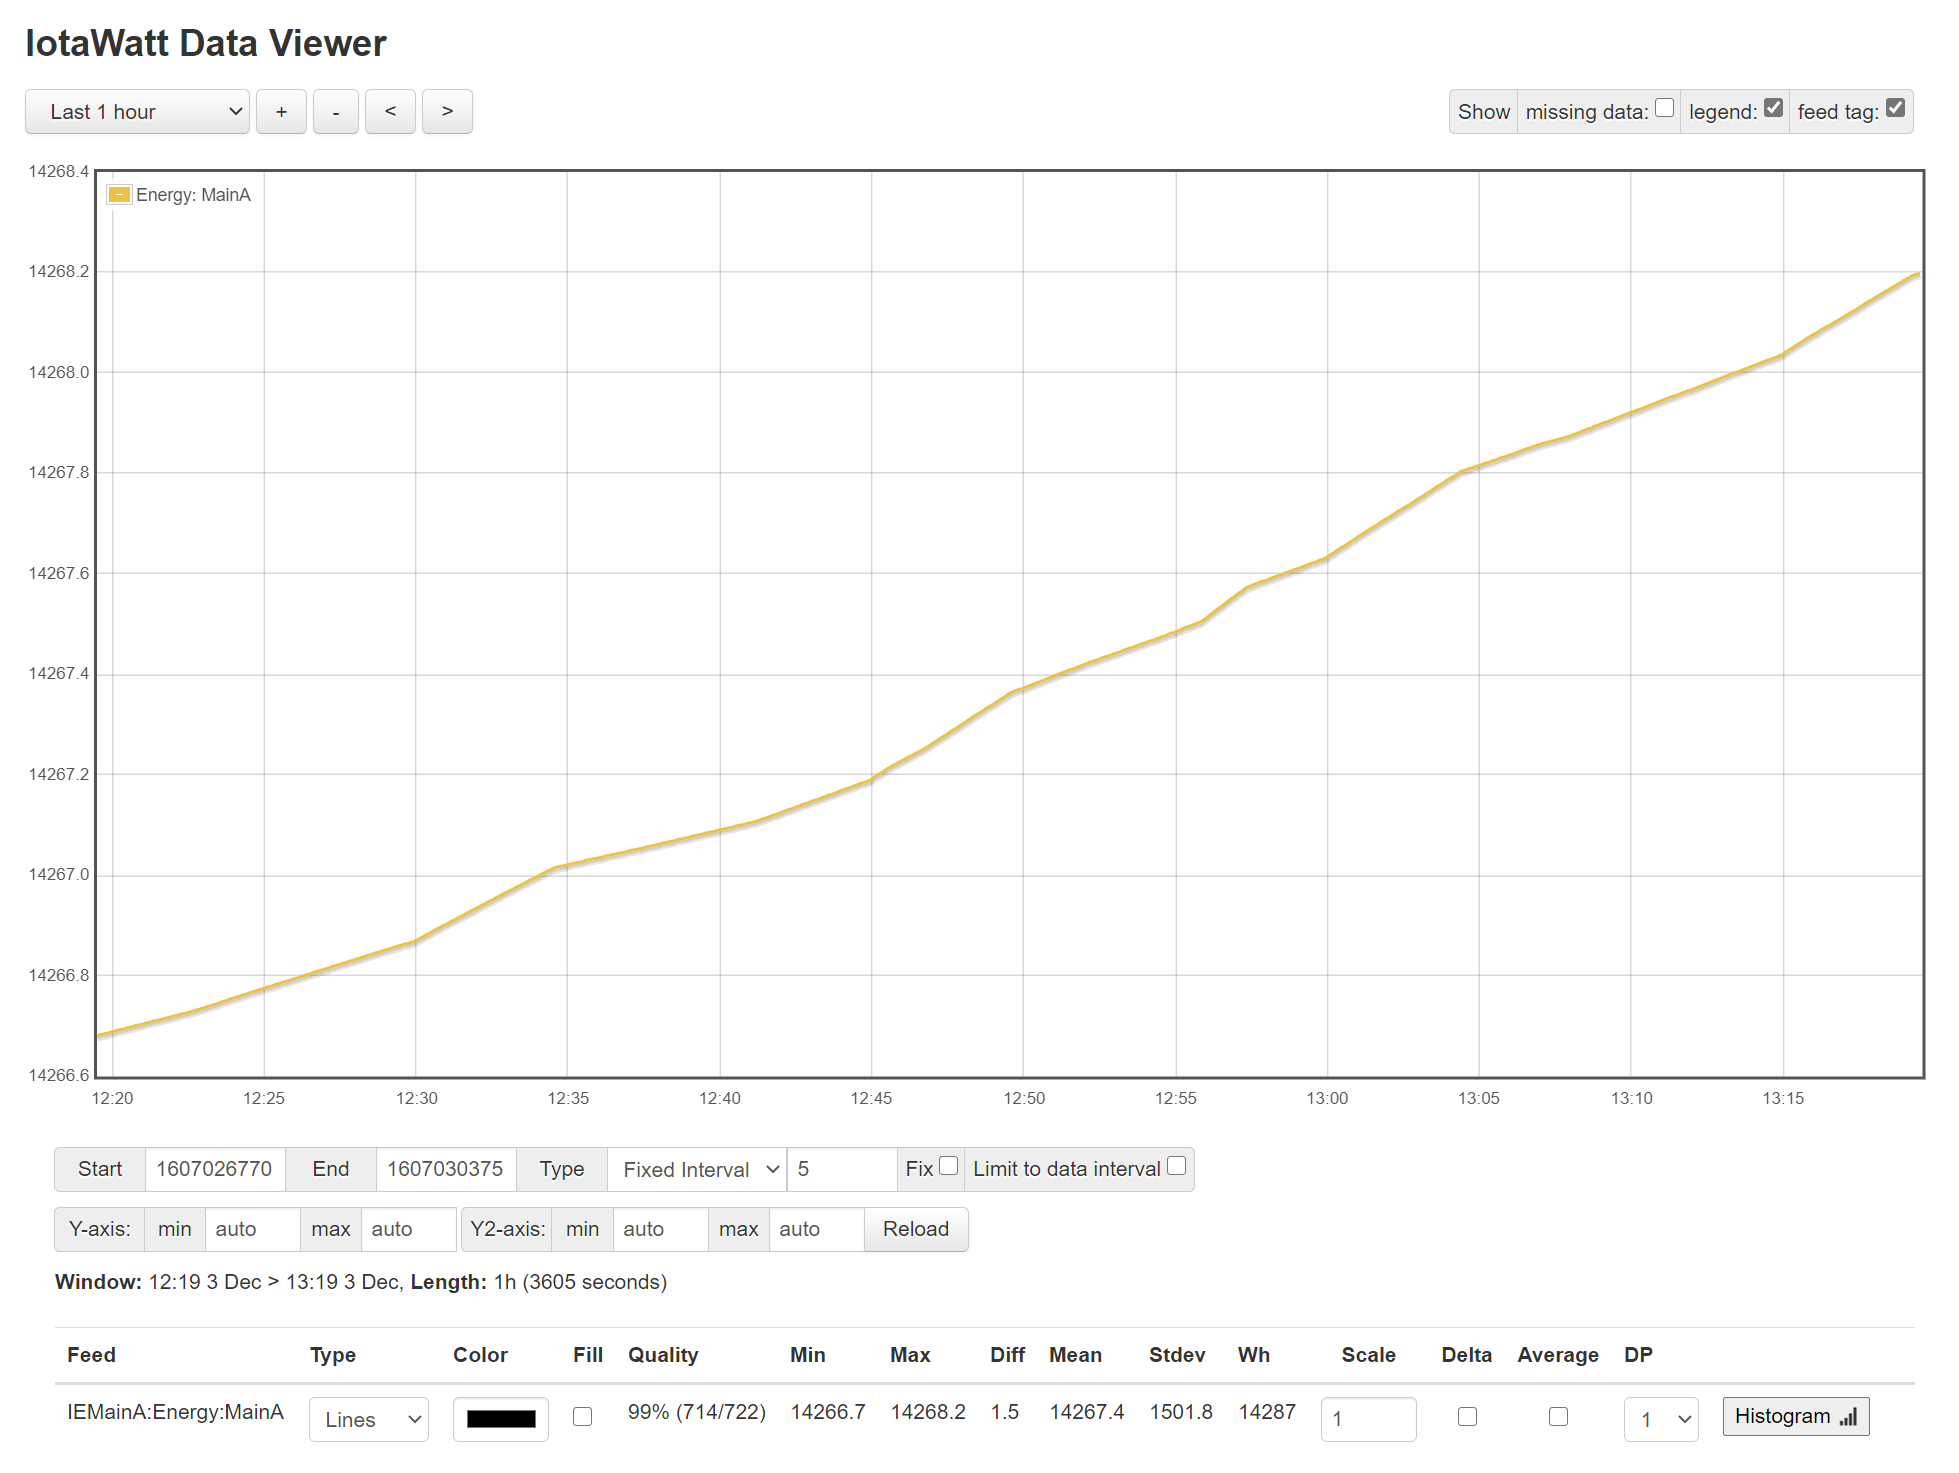
So, I am finally getting around to setting up influxdb. I have two IotaWatt devices that have been collecting data for a long time. It appears that only data from the Current Log is able to be sent to influxdb, which is fine with me (most of the data is not really that interesting). Anyway I have IotaWatt which is on the A leg. It says:
Current Log from: 6/22/2020 1:45:15 PM to: 12/2/2020 11:48:25 AM
IotaWatB is on the B leg, it says:
Current Log from: 12/3/2019 11:50:10 AM to: 12/2/2020 11:50:05 AM

After a few false starts, I started them both on the same influxdb instance. A is sending 15 measurements (14 channels of Watts and 1 of Volts). B is sending 14 measurements (13 channels of Watts and 1 of Volts).

The last bit of B’s log is this:

12/01/20 08:25:53 influxDB: started, url=HTTP://192.168.1.192:8086, db=power, interval=10
12/01/20 08:25:54 influxDB: Start posting at 01/01/19 00:00:10
12/02/20 07:19:56 Updater: Invalid response from server. HTTPcode: -4

A’s log has this:

12/01/20 08:26:16 influxDB: started, url=HTTP://192.168.1.192:8086, db=power, interval=10
12/01/20 08:26:18 influxDB: Start posting at 01/01/19 00:00:10

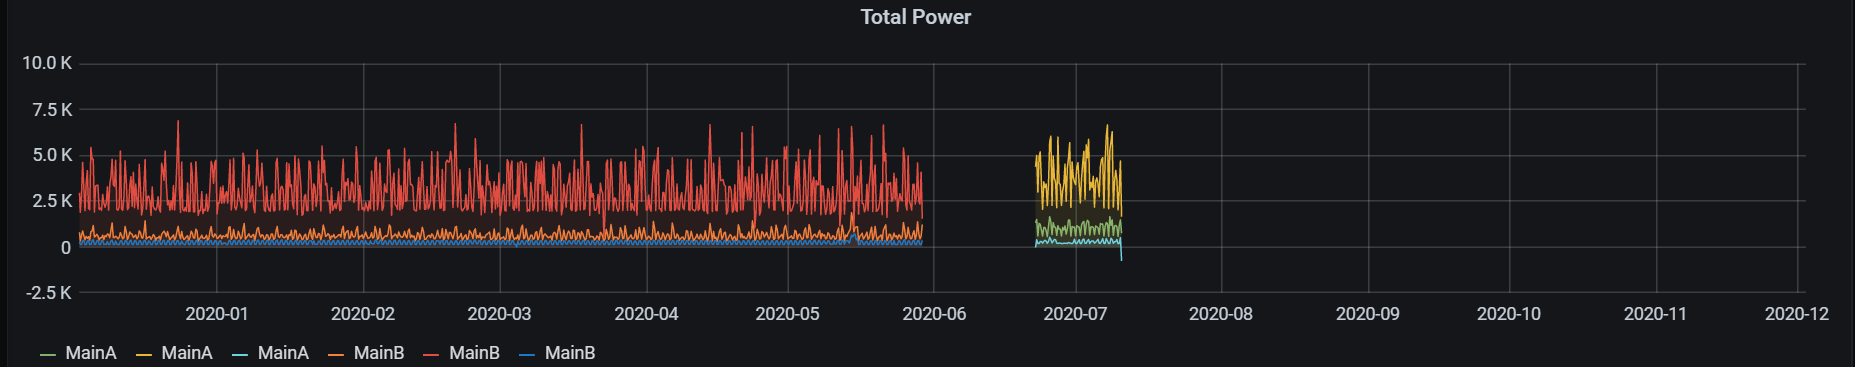
As you can see, they both started posting at about the same time (yesterday morning)
B has posted from mid December 2019 to almost May 2020 (almost 5 months)
A has posted from mid June 2020 to almost mid July 2020 (about a month)

Any idea what is going on?
No errors indicated in the log. Both are in the same location. RSSI is a little better for A, but B is generally at -76dB

I don’t have a good feeling about this one. You’re right that the service only works out of the current log. That’s because the history log is at 1 minute intervals. I suppose it could have done 1 minute posts, but there are some issues that I won’t get into right now.

Looking at the code, there appears to be a black hole that could be caused by starting it up with a date prior to the start of the current log. I don’t know quite what to expect, but I do believe it has a pretty good chance of causing trouble.

I think both might take quite awhile to slog through time from 1/1/19 to their current log start, doing who knows what. Be interesting to see if you have any influx entries from those periods. Leg A had to plow through 18 months and leg B 11 months. So it’s possible B had a leg-up on A in getting to it’s real data faster, and now they are on more equal footing.

Looks like I’m going to be in there soon and its an easy fix to make the current log start the lookback floor. My guess right now is that they will proceed at about equal pace from here.

My first thought was also that being excessive with the start time was an issue. But, it appeared both figured out the actual start of data quickly and were posting. When I am watching them (status page) both seem to be going at about 2-3min per update (which is every second it seems). That says that they should be doing about 120 to 180 times realtime. So it will take 3 days to a week to do a year. In a day and a half (not quite) the B one has done about 6 months, so it is matching my expectations. The other one has not completed a month yet.

Both are running:
IoTaWatt 4.x, Firmware version 02_05_11

There is nothing in the log after the message that says it has started posting data to influxdb.

Both are feeling the load of pushing this much data, and are managing less than 30 AC cycles sampled/second. The B one is averaging fewer, so maybe it is trying to send more for some reason. Both are set to a post interval of 10s with bulk send of 6. Free heap is at 19-24K and goes up and down on both (as expected). It doesn’t look like there is anything wrong, just one is a lot slower (like someone forgot to push the turbo button on it :wink: )

I know this is not your normal use case, and you can say you didn’t design it to be able to do this. It does appear to be working and I do understand there are significant limitations on the esp8266.


The reddish lines are from Leg B. As you can see there is about 6 months of data uploaded. The yellow and green lines are from Leg A. It has only managed a month or so. I had an issue with this device and it had some SD card corruption so I deleted the datalog (which is why it is has less data). Not sure if that might be causing it to be slow or not.

30 AC cycles/second is fine, that’s twice a second for each channel. It maxes out at 40 at 60Hz anyway. No idea why one is faster. You could try stopping the B to see if A speeds up.

Don’t recall what you are hosting influx on. As I understand it, there is a lot of in-memory work, and you are trying to shovel data into two different time periods, so maybe that could have something to do with it. My guess is that the normal use case for influx is the here-and-now. Be interesting to pause the B uploads and see if A takes off.

Did some more investigation and it looks like the SD card and some of the data on it was corrupt. I discovered this by looking at the IotaWatt and saw that it was showing red sometimes. I unplugged it and pulled the SD card. It looked okay on my PC, but I took a spare SD card and reformatted it and copied all the data to it. I then put it back in place. I noticed that it was stuck on July 11th, so I told it to start from August. That got it moving. I then noticed that the Grafana graph was looking weird. It had some really strange (large) numbers. So I went to influxdb and did this:

> select * from iotawatt where Watts > 10000
name: iotawatt
time                Volts Watts                   channel  device
----                ----- -----                   -------  ------
1594426430000000000       743184941.77            Furnace  IotaWatt
1594426430000000000       200692762.13            HPWH_A   IotaWatt
1594426430000000000       3.9759610513759245e+161 Washer   IotaWatt
1594426430000000000       3562910992.6            MainA    IotaWatt
1594426430000000000       249266448.86            k13      IotaWatt
1594426440000000000       27401210191.42          Washer   IotaWatt
1594426440000000000       779295162956.35         MB_Floor IotaWatt

Pretty sure the washer was not really using that much power, especially not more than the Main. Figured out the magic to delete the bad points:

Delete from iotawatt where time=1594426430000000000
Delete from iotawatt where time=1594426440000000000

It still had some bad data at 5:13:40PM on July 10, 2020 (NAN), figured out the epoch time for that and did a query:

select * from iotawatt where time=15944264200000000

but there was nothing there

Delete from iotawatt where time=1594426420000000000

did fix the problem.

This was on my IotaWatt that has had a corrupted SD card before. I reformatted the card about 6 months ago, but did not replace it at that time. I have now replaced the card, so hopefully that cures the problem.

It’s been a very long time since anyone has reported SDcard problems with IoTaWatt. I’m not seeing any direct evidence of it here.

What you are displaying is the data stored in influx, not IoTaWatt. It may be that your datalog has a corrupted record for July 11, 2020 00:13:50UTC, but the question is how did IoTaWatt pass a value like 3.9759610513759245e+161 to influx? Before I buy into a problem with the IoTaWatt datalog, I’d like to at least look at what it has to say about this data.

So lets take a look. Using the old graph program, can you plot kWh (energy) on the washer on Jan 10-11, 2020? And then separately for MainA? If those big numbers are there, the kWh should jump dramatically at 00:13:50.

The datalog has some really bad data in it. It is about 1GB. I can put it on a share if you want to look at it.

7/10/2020 16:56	806.5	10.2	0.4	233.3
7/10/2020 17:06	-12581673.3	3157623544	0.3	233.9
7/10/2020 17:16	12583987.1	-3157684478	0.3	233.4
7/10/2020 17:26	1056.4	141.7	0.3	58.9

Seems like something got confused on July 10 at around 5 PM.

more better picture

I’d like to see your message log. Can you upload in a PM?

The old graph shows the problem at that instant (local time). I’d like to see that graph of Energy (kWh) not Power (Watts). What you see in Graph+ is not representative. This isn’t about the SDcard, it’s about one or two bad records in the datalog.

When you reformat or replace the SDcard, then copy the datalog files, the problem stayed with the file. There are a couple of solutions to this, but the cleanest is to wipe both datalogs and start over. What is the status of your upload? If you can get the data to influx, you can retain your history there. When you are ready, I’ll tell you how to do it.

I sent you a PM with the message log

Here we have a graph at 60sec samples covering the time period (looks fine)

Now here it is at 30sec samples:


Not sure if that is fine or not.

Here it is overlayed with the power:

I know how to wipe the data and history log and am planning on doing that after the upload is complete and I rearrange some inputs with my new design.

I know that you believe SD card corruption is exceedingly rare in IotaWatt. I won’t dispute that. I have now seen what I believe to be that on at least 3 occasions. But all have been on the same IotaWatt with the same SD card. I have another IotaWatt that has had no issues at all. At least one of those issues involved a significant number of power loss restarts (probably due to a loose USB cable). Pulling power at just the right/wrong time can really cause bad things to happen. So, that explains at least one of them. I have lost confidence in the SD card that was in the device, so I have now replaced it with another one. It is still a cheap Kingston 8GB card, so I will order a new high quality SD card (since I will feel better about that, the IotaWatt might not care :wink: ). I will also hook both of my IotaWatts up to the new mini UPS that I recently bought to eliminate fluctuating power as a potential source of issues.

Many people say that exceedingly rare events happen around me a lot, so don’t read this as I believe IotaWatt is a bad product. I have been very happy with it and it has worked very well and I expect it will continue to do so. Bob has also been very generous with debugging issues that I have experienced

If I try and get the graph to go at a smaller fixed interval, it appears to hang/do nothing. I am pretty sure it is doing a query to get the data. I can try that directly.

Data from this query:
/query?select=[time.local.unix,MainA.wh]&begin=1594409910&end=1594440750&group=5s

baddata.json (288.0 KB)
Looks like this is where it starts going bad:

[1594401090,1],[1594401095,1],[1594401100,1],[1594401105,1],[1594401110,1],[1594401115,1],[1594401120,1],[1594401125,1],[1594401130,1],[1594401135,1],[1594401140,1],[1594401145,1],[1594401150,1],[1594401155,1],[1594401160,1],[1594401165,1],[1594401170,1],[1594401175,1],[1594401180,1],[1594401185,1],
[1594401190,null],
[1594401195,3],
[1594401200,2],[1594401205,-2],
[1594401210,2],[1594401215,-2],
[1594401220,2],[1594401225,-2],
[1594401230,2],
[1594401235,19],[1594401240,-19],
[1594401245,19],[1594401250,-19],
[1594401255,19],[1594401260,-19],
[1594401265,19],

This query did not return a full set of data, so it probably got really confused by what is in the data log. It does appear to be able to skip around the bad part.

Query and Graph+ which uses query are not useful tools for figuring this out. Some of those data points come from the History log and some from the current log. When it all works its great, but what you have there is meaningless.

Take a look at the old plot above and ask yourself why the area after the incident is solid yellow from near zero to 10,000kWh? The answer is that you are getting 30 second intervals, and the even minutes are coming from the history log, and the half-minutes are coming from the current log. So It’s really just a whole lot of up-down-up-down. The question is which one is up and which one is down?

That’s why I asked for a plot at one minute intervals, to figure out exactly where the damage is. You may not need to delete all of your data. The power plot is derived from the energy plot, so that is of no help at all because all of the data is a combination of the two logs.

If you are going to diagnose and fix this yourself, I would caution you to better understand the whole dynamic. Without knowing what is wrong, you may find temporary relief only to have other problems in a few months. The gold standard is to delete both logs simultaneously. There is a command for that. Otherwise, the new log is created using data from the remaining log and you can perpetuate problems.

The IoTaWatt only writes each datalog block twice (holds two records). That’s it, until it wraps and then it writes each one two more times. SDcard wear, and damage, is a function of writes. Most cards can take 100,000 or more writes per block, and they have active wear leveling to remap blocks as they are used heavily. It works fine. There are probably billions of these things out there. If they didn’t work, an alternative would exist.

I didn’t see an ask for 1 min intervals here or in PM, but since you asked for it now, here it is:

Here is the same time period with 5 sec interval:

My plan for deleting was to remove the SD card and delete the datalog, but am open to the correct way to fix this.

As far as SD cards go, from what I have read (and experienced) they actually have a decently high failure rate. There are much better things out there, but they cost a lot more than SD cards. SD cards are designed to be cheap. There are also a large number of cards of questionable quality.

You might remember that the last time I had a problem with this device, the data in the directory/filesystem got corrupted. One of the files got a name with non-standard characters. I also had the data log get corrupted before. That can and does happen when power quality is poor and the logs show that was happening around the time of the last failure.

I am planning on moving some circuits around, so I can reset everything to get a clean start when I do that. I also replaced the SD card so if it was a defective card that problem should also be solved. If there is any more data you need/want, let me know.

Did a little more investigation on the file: iotalog.log
The directory lists the file as 722,109,696 bytes, but when I view the file with a hex editor, the data stops at e0e0dc0 which is 235,802,048. When I try the same thing on the older log file I have, I can see data to the end of the file (107.020,288 bytes). So, it definitely looks like it is not in a happy state.

This IotaWatt is on the Alpha release channel, so maybe that had something to do with it, but I am leaning more towards a combination of bad power and a marginal (at best) SD card.

The other weird thing was that I added Amps to the main channel as something to send to influxdb, but did not change anything else. I expected it would start from where it was currently (September), or from where I told it to (August). But, no, it started from the beginning of the datalog. I just happened to be watching it at the point at which the datalog is bad and it reset back to the beginning of the data log. I then updated the service again and this time it started at August (past the bad data). It looks like both IotaWatts are now progressing at about the same pace, so I think the issue is resolved.

Through some, possibly exceedingly rare, event, my datalog got corrupted. This caused the upload to influxdb to get in a loop. This is probably the edge of a corner case, so it is unlikely anyone else will run into it. It looks like most of the data is fine and the process is working okay now that I skipped over the bad data.

Thought I did, sorry. The one minute plot would be the History log only, and it looks fine for the period in question. It’s quite possible that the History log is OK. Can you plot the kWh of the Main from July to now, and then the an hour today using the old plot?

722Mb would be about 163 days. Sounds right. Don’t know what you are using for an editor, but the IoTaWatt does read parts of the file at startup and it’s unlikely you would still be running if it’s only 235Mb. Also, careful looking at the contents of files written by an ESP8266. It is a little-endian machine so some of the data can be backwards.

This is the kind of speculation I try to discourage here. There have been two Alpha releases since July and both were uneventful and went to full Minor quickly without incident. Maybe an SD card issue, but not at all conclusive.

Here is July to now (looks fine to me):

Here is the last hour (also fine)

There is some bad data in the “history”. Based on what I know about the way the data is saved, the HISTLOG.LOG file seems like it is okay. The iotalog.log appears to have some “not so good” data in it. How that data got in there will probably always be a mystery. Since I do have another IotaWatt and it was running at the same time. I looked at it to see if there was a power outage then (there wasn’t).

Going back to the message log around the time of the event there is nothing particularly interesting:

** Restart **

SD initialized.
6/22/20 20:45:10z Real Time Clock is running. Unix time 1592858710 
6/22/20 20:45:10z Power failure detected.
6/22/20 20:45:10z Reset reason: External System
6/22/20 20:45:10z ESP8266 ChipID: 2222239
6/22/20 20:45:10z IoTaWatt 4.x, Firmware version 02_05_09
6/22/20 20:45:10z SPIFFS mounted.
6/22/20 13:45:10 Local time zone: -8:00
6/22/20 13:45:10 Using Daylight Saving Time (BST) when in effect.
6/22/20 13:45:10 device name: IotaWatt
6/22/20 13:45:13 HTTP server started
6/22/20 13:45:13 WiFi connected. SSID=FrogmoreN66, IP=192.168.1.38, channel=1, RSSI -72db
6/22/20 13:45:13 MDNS responder started for hostname IotaWatt
6/22/20 13:45:13 LLMNR responder started for hostname IotaWatt
6/22/20 13:45:13 timeSync: service started.
6/22/20 13:45:13 statService: started.
6/22/20 13:45:13 Updater: service started. Auto-update class is ALPHA
6/22/20 13:45:14 dataLog: service started.
6/22/20 13:45:14 dataLog: New current log created.
6/22/20 13:45:14 dataLog: Last history entry: 06/15/20 21:39:00
6/22/20 13:45:15 Updater: Auto-update is current for class ALPHA.
6/22/20 13:47:13 historyLog: service started.
6/22/20 13:47:13 historyLog: Last log entry 06/15/20 21:39:00
6/24/20 07:49:29 Updater: Invalid response from server. HTTPcode: -4
7/10/20 22:29:32 Updater: Invalid response from server. HTTPcode: -14
7/15/20 02:39:22 Updater: Invalid response from server. HTTPcode: -4
8/03/20 14:32:16 timeSync: Six week routine restart.

The log starts when I powered up the IotaWatt with the datalog removed (from the previous time it got in a bad state). I did not clear the history log. It looks like a mystery. I am willing to accept that. Stuff happens.

Yes, that is just history log.

That is a combination of history log and current log data. It does also look fine. That means that the two logs are in sync. It also means that the damage probably happened after July 10 because the history log is just a subset of the current log records, unaltered except for a sequence number.

So given that you have a new SDcard, deleting only the current log should be OK and will retain all of your history in the history log. You can remove the SDcard and manually delete it, or you can use the command

http://<device name>.local/command?deletelog=current

Careful with this and be sure you address the correct unit as it is not reversible.