Hi. I was wondering if it’s expected for there to be a small amount of variance between data sent to InfluxDB and the same data graphed in InfluxDB. It’s only a tiny amount, but added up over months it may lead to inaccuracies.
I have a Grid integrator setup with a GridImport output defined as: Watts = Grid.pos which i’m sending as is to InfluxDB.
When I compare the output of hourly grouped buckets with the same time range and the same output I get slightly different results:
InfluxDB query:
from(bucket: "iotawatt")
    |> range(start: v.timeRangeStart, stop: v.timeRangeStop)
    |> filter(fn: (r) => r["_measurement"] == "GridImport" and r["unit"] == "Wh")
    |> aggregateWindow(every: 1h, fn: sum, timeSrc: "_start")
    |> cumulativeSum()
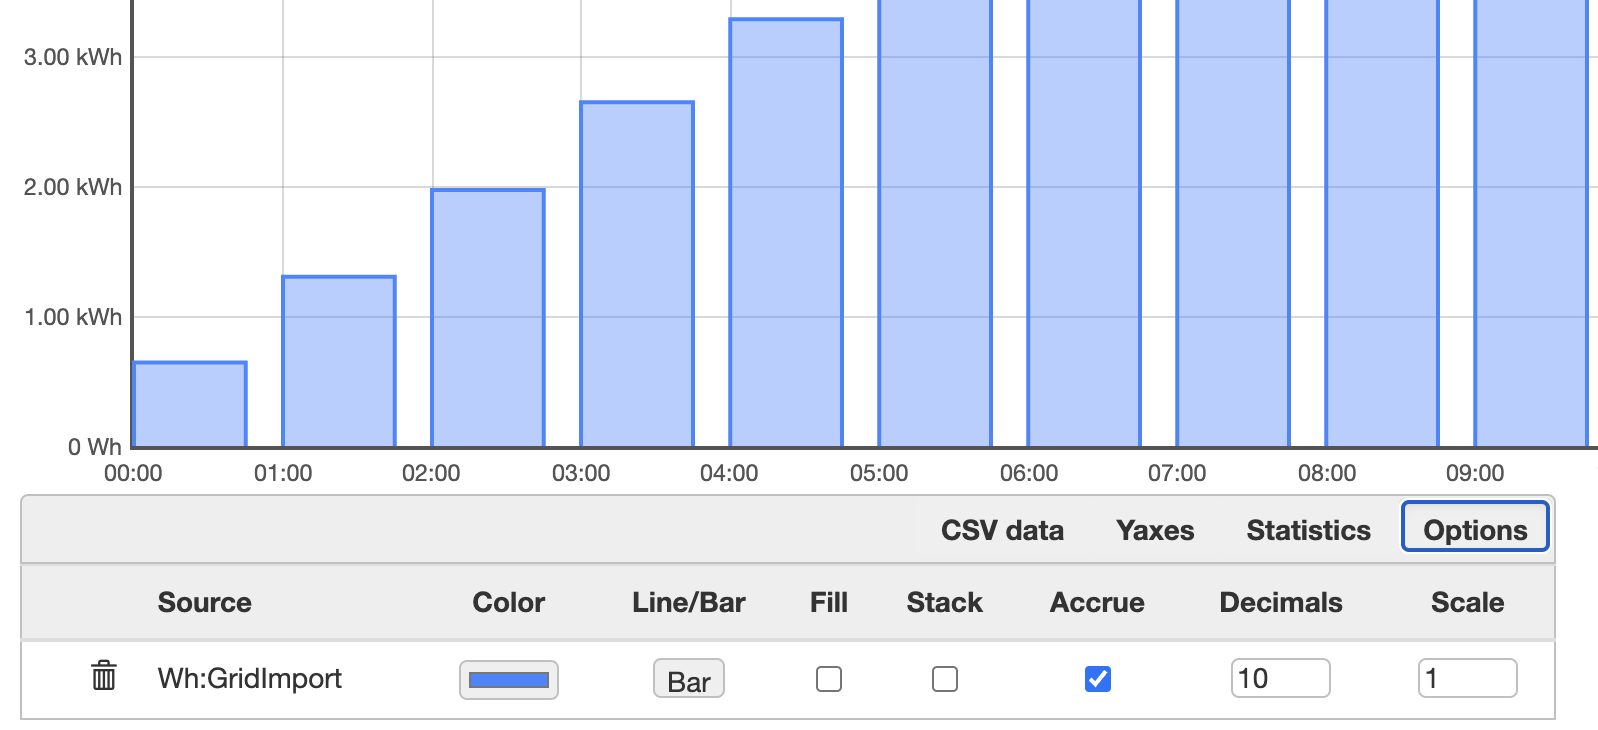
Graph+
InfluxDB values:
2023-04-03 00:00:00, 635
2023-04-03 01:00:00, 1287
2023-04-03 02:00:00, 1948
Graph+ values:
2023-04-03 00:00:00, 643.9262000000
2023-04-03 01:00:00, 1306.1516000000
2023-04-03 02:00:00, 1976.6862000000
Is this to be expected?
EDIT:
When I define an output of (GridA + GridB + GridC) max 0 however, I get matching values in both. Is it more accurate to use an integrator or to calculate it manually?
It looks like the drift between the two calculation starts to increase as my solar output increases:
date,GridImportManual,GridImportIntegrator,SolarGeneration
2023-04-03 07:28:00, 5033.88, 5033.88, 18.30
2023-04-03 07:30:00, 5036.41, 5036.70, 22.16
2023-04-03 07:32:00, 5037.02, 5038.85, 24.42
2023-04-03 07:34:00, 5037.02, 5039.16, 35.25
2023-04-03 07:36:00, 5037.02, 5039.16, 45.37
2023-04-03 07:38:00, 5037.02, 5039.16, 55.07
2023-04-03 07:40:00, 5037.02, 5039.16, 52.63
2023-04-03 07:42:00, 5037.02, 5039.16, 64.01
2023-04-03 07:44:00, 5037.02, 5039.33, 40.77
2023-04-03 07:46:00, 5037.02, 5039.33, 38.71
2023-04-03 07:48:00, 5037.02, 5039.66, 33.92