Influxdb What Works?

There is some information on how to set up influxdb, but some of it is confusing, especially if you don’t already know the details of how Influxdb works and what you want to do with the data (perhaps Grafana?). Like with many things, it is best to first think about what you want to achieve. I didn’t really start here, but now that I have done some stuff I decided to think about it a little first.

  1. Curious about what is going on with my usage
  2. Curious about what is going on with voltage, since my house is far from the transformer and very far from the substation
  3. Interested in if the heating elements on either water heater come on or not
  4. Interested in the maximum consumption to see if it ever exceeds what the generator could provide (and if I need to implement demand-side-load management to prevent the possibility)
  5. Monthly (or 30day might be close enough) usage
  6. How much is the heated floor in the bathroom cost to run (do I need to create a more sophisticated control system for it, simple timer now)
  7. How much do the water heaters cost to operate
  8. How much does me working from home cost
  9. How much does the recirculation pump that provides instant hot water really cost (does it make sense to have a more sophisticated control system)
  10. How much does the dehumidifier in the basement cost
  11. Is the dehumidifier working correctly and has its efficiency dropped

Wow, that is a lot of stuff. IotaWatt with some additional help from Influxdb and Grafana can do almost all that and probably more.

I first started trying to understand what others had done with Influxdb. I found this: IotaWatt: Multi-Tenant Setup using InfluxDB v1 – Brett Beeson
It got me pretty close, but it was missing some key pieces of information, and things have changed somewhat since it was written.

  1. Use Influxdb 1.8 (do not use the 2.0 version as it is not compatible with IotaWatt at this time, so far that is not an issue
  2. There are lots of tutorials and information about Influxdb on the internet, It is good to understand what it can do and the choices.

You need to have, at least, a basic understanding of databases, measurements, tags and fields. For a normal home setup up you only need one database. You can call it whatever you want. I have used iotawatt and also Power and power. I believe it is case sensitive, so pick wisely (you can change it later if you really don’t like your first choice).

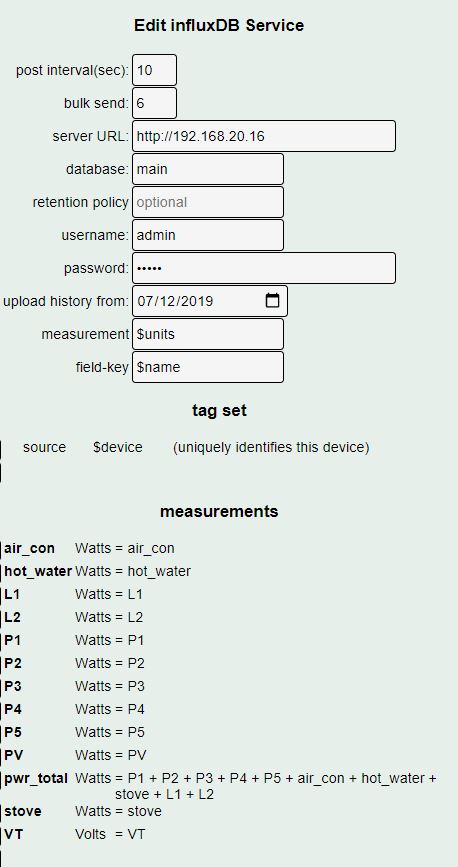
Iotawatt gives you the ability to choose how you use tags and fields. Brett Beeson has a tag set that uses $device, $name, and $units. I couldn’t get $units to work, but I might have done it wrong. The tags are what allow you to do groups of things. I used channel instead of sensor, but that is personal preference.

The part that was not clear (at first, to me) was that I needed to add each thing that I wanted to send to Influxdb in the measurements section. Doing this is a bit tedious. It allows you to use a different name than actual channel name in Iotawatt, which makes sense, since you can do math there. I didn’t do/need any math there.

I did not do any of the continuous queries to generate KWH. I do that in Grafana. The (currently) very latest version has beta support for flux queries. Flux allows math across measurements (and series, which are specific measurements). I need this to get the total from legs A and B. For graphs, using stacking will get something similar without needing to actually add all the numbers. But, I wanted some boxes for 24hr usage for the whole house.

There was someone how shared their JSON from Grafana. I used that as the starting point, but mine is not really in a state to share yet. Once it is ready, I will share it.

I will add more to this later, including how to use Flux and how to debug it.

3 Likes

Your experience seems very similar to my recent experience. I’ve attached my influxDB settings


I’ve kept my IoTaWatt input names short & simple (correspond to the switchboard circuit names) because influx queries can have descriptive aliases. I’ve had no problems with any of the 3 meta variables - $units, $name or $device. They all get imported into the influx database as expected. Note I included as a convenience for influxQL queries, a “total_pwr” input which is the sum of the other inputs (not including PV).

So a simple influxQL query to display the last row would be:

select * from Watts order by time desc limit 1

with output eg

name: Watts
time                L1   L2   P1   P2  P3    P4    P5 PV      air_con hot_water pwr_total source   stove
----                --   --   --   --  --    --    -- --      ------- --------- --------- ------   -----
1607117730000000000 3.56 0.74 51.1 0.1 30.88 58.75 0  1167.08 1.57    0.62      147.33    IotaWatt 0

I solved a Grafana “bug” (or lack of feature) yesterday in which a influxQL GROUP BY(1d) clause didn’t allow the current/ default timezone to be implied. Without this the query results are split on non-midnight boundaries. Here’s my query for kWh/day:

SELECT SUM("pwr_total") / COUNT("pwr_total") * 24 FROM "Watts" WHERE $timeFilter GROUP BY time(1d) TZ('Australia/Hobart')

partial output

2020-11-30T00:00:00+11:00 4837.459944444466
2020-12-01T00:00:00+11:00 4214.7862777777655
2020-12-02T00:00:00+11:00 4489.356722222229
2020-12-03T00:00:00+11:00 4105.727722222204
2020-12-04T00:00:00+11:00 5077.2341666666725
2020-12-05T00:00:00+11:00 3292.258463508315

Another hard learnt tip: in a query, time is normally displayed as a Linux timestamp to nanosecond resolution, not a very user friendly format; instead to display in local time enter the influx command: precision rfc3339, and append the TZ clause to the end of any query, eg. TZ(‘Australia/Hobart’). Then the 1st (shortened) query

select L1 from Watts order by time desc limit 1 TZ('Australia/Hobart')

outputs

name: Watts
time                      L1
----                      --
2020-12-05T08:38:30+11:00 3.49
1 Like

Thanks for sharing, some really good tips there.
That is an interesting setup for pwr_total. I have a CT on MainA and MainB that measure the panel total. They are actually on different IotaWatts, so I have to do the math using a Flux query. It is this complication that has kept me from using influxdb until now. I would have expected your L1 and L2 were your equivalent to my MainA and MainB.

Also your math for WHr is not the normal way to do that. You appear to be taking the average Watts consumed over a 1 day period and then multiplying that by 24 to get WHr. I suspect that will get you very close to the other way of calculating it:

SELECT integral("pwr_total")  / 1000.0 / 60.0 / 60.0  FROM "Watts" WHERE $timeFilter GROUP BY time($__interval) fill(null)

Integral runs on 1 sec, so 60*60 converts it to hour. The 1000 converts it to K(WHr). Grafana makes it easy to change the units from WHr to KWHr, so it is not necessary to divide by 1000. It does change the values you need to use limits, so best to pick one set of units and stick to it.

I almost never look at the influxdb data directly

I did try INTEGRAL() at one stage while I was having trouble with the GROUP BY (1d) breaking at the time zone. So I reverted to SUM / COUNT, which as you say is doing the same thing. INTEGRAL is more readable so will revert to that now I have the TZ() figured out, thanks.

The TZ() is quite confusing. You’d think

SELECT count("pwr_total") FROM "Watts" WHERE $timeFilter GROUP BY time(1d)

would group @ midnight boundaries. but instead gives me this (I’m UTC+11:00):

Dec 1st, 2020 @ 11:00:00 am 4494358
Dec 2nd, 2020 @ 11:00:00 am 16801380
Dec 3rd, 2020 @ 11:00:00 am 14632211
Dec 4th, 2020 @ 11:00:00 am 13290954

When you add the TZ() clause I get the intended results (there’s ongoing Grafana discussion about how to handle this more gracefully in future):

Dec 2nd, 2020 @ 12:00:00 am 16161149
Dec 3rd, 2020 @ 12:00:00 am 14780437
Dec 4th, 2020 @ 12:00:00 am 18277317

I note there is a subtle difference for some days between INTEGRAL() & SUM() / COUNT(). There are possibly a few measurements that weren’t exactly every 10 seconds.