Your experience seems very similar to my recent experience. I’ve attached my influxDB settings
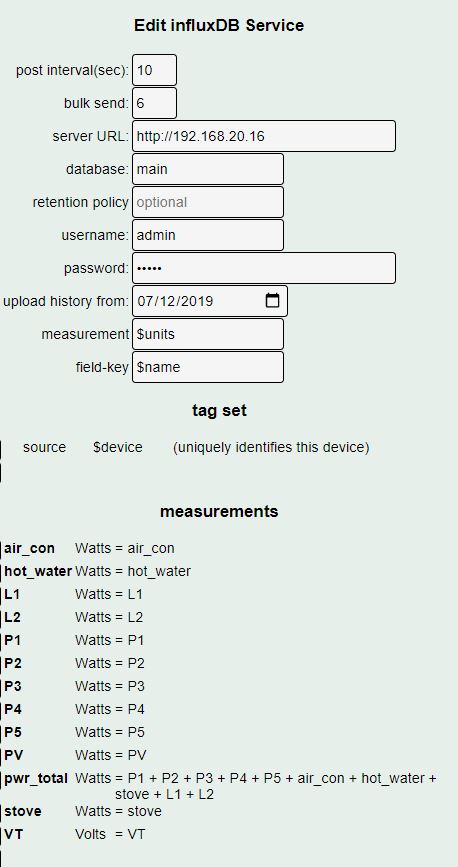
I’ve kept my IoTaWatt input names short & simple (correspond to the switchboard circuit names) because influx queries can have descriptive aliases. I’ve had no problems with any of the 3 meta variables - $units, $name or $device. They all get imported into the influx database as expected. Note I included as a convenience for influxQL queries, a “total_pwr” input which is the sum of the other inputs (not including PV).
So a simple influxQL query to display the last row would be:
select * from Watts order by time desc limit 1
with output eg
name: Watts
time                L1   L2   P1   P2  P3    P4    P5 PV      air_con hot_water pwr_total source   stove
----                --   --   --   --  --    --    -- --      ------- --------- --------- ------   -----
1607117730000000000 3.56 0.74 51.1 0.1 30.88 58.75 0  1167.08 1.57    0.62      147.33    IotaWatt 0
I solved a Grafana “bug” (or lack of feature) yesterday in which a influxQL GROUP BY(1d) clause didn’t allow the current/ default timezone to be implied. Without this the query results are split on non-midnight boundaries. Here’s my query for kWh/day:
SELECT SUM("pwr_total") / COUNT("pwr_total") * 24 FROM "Watts" WHERE $timeFilter GROUP BY time(1d) TZ('Australia/Hobart')
partial output
2020-11-30T00:00:00+11:00 4837.459944444466
2020-12-01T00:00:00+11:00 4214.7862777777655
2020-12-02T00:00:00+11:00 4489.356722222229
2020-12-03T00:00:00+11:00 4105.727722222204
2020-12-04T00:00:00+11:00 5077.2341666666725
2020-12-05T00:00:00+11:00 3292.258463508315
Another hard learnt tip: in a query, time is normally displayed as a Linux timestamp to nanosecond resolution, not a very user friendly format; instead to display in local time enter the influx command: precision rfc3339, and append the TZ clause to the end of any query, eg. TZ(‘Australia/Hobart’). Then the 1st (shortened) query
select L1 from Watts order by time desc limit 1 TZ('Australia/Hobart')
outputs
name: Watts
time                      L1
----                      --
2020-12-05T08:38:30+11:00 3.49