I’m stuck trying to figure out how to get data uploaded to influxdb. I’ve read all of the related forums I can find, and I’m not able to solve my problem.
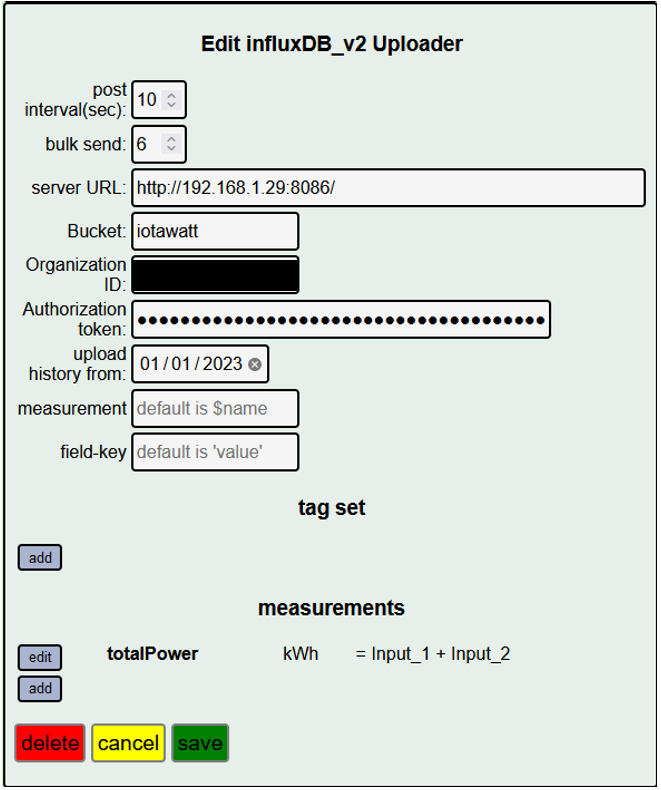
I’m running influxdb v2 on a local docker server. With the following config, I keep getting a 404 error when I look at the status page, and I’m not seeing any data from Iotawatt when I query influxdb. Any suggestions on what might be wrong with my config?
Since you are running V2 of InfluxDB you can point a browser from a different computer at that URL and see what happens. You should get the Web UI. You can also try sending a line protocol request to that address, also from a different computer than the one hosting Docker/InfluxDB.
Thanks for the responses. I’ve gotten influxDB setup using that URL, I’ve manually added data and visualized it, confirming that the database is setup and capable of taking in data. At one point I was getting an error message stating that I needed to setup an HTTPS proxy server, even though I never provided an https URL. That error went away, though I don’t know why. I only get the 404 error now.
One other thing I’ve noticed is that I can stop the uploader, and I see a stop message in the message log. I try to start the uploader from the status page, and the uploader appears to start based on the status page, but I never see a start message in the message log. Not sure if I should see a start message in the log?
Error message where? It just went away without changing anything? Put yourself in my position, how am I supposed to determine what is going on if you are reporting changing problems without any change in your setup?
Do you have wireshark? I’d suggest you capture one of these 404 transactions.
Thanks for the suggestion, I installed wireshark and reviewed traffic from the IP address iotawatt is assigned. I only saw communication between iotawatt and the computer I’m using to interact with iotawatt, there was no communication between iotawatt and the local server hosting influxdb.
I see a number of HTTP/1.1 200 responses from iotawatt to my computer, but I don’t see any 404 responses. Is that what I should expect to see since iotawatt is telling me it’s getting a 404 code?
The 404 should come from your influx machine to the IoTaWatt. I am also interested in the post from the IoTaWatt to your influx unit that illicit that 404 response.
Sorry for the delay, I had to step away for a bit. I have recreated the issue, and I have uploaded a log of all web traffic associated with the iotawatt IP address, and the iotawatt message log. Here’s what the log should show:
I start a monitoring session with wireshark, filtering so it displays all traffic associated with the IP address for iotawatt.
I ping the iotawatt from my working PC to ensure I’m talking to the right device and it’s responding.
I open the iotawatt.local interface in a browser and restart the iotawatt using the interface
The iotawatt restarts, and the influxDB service starts
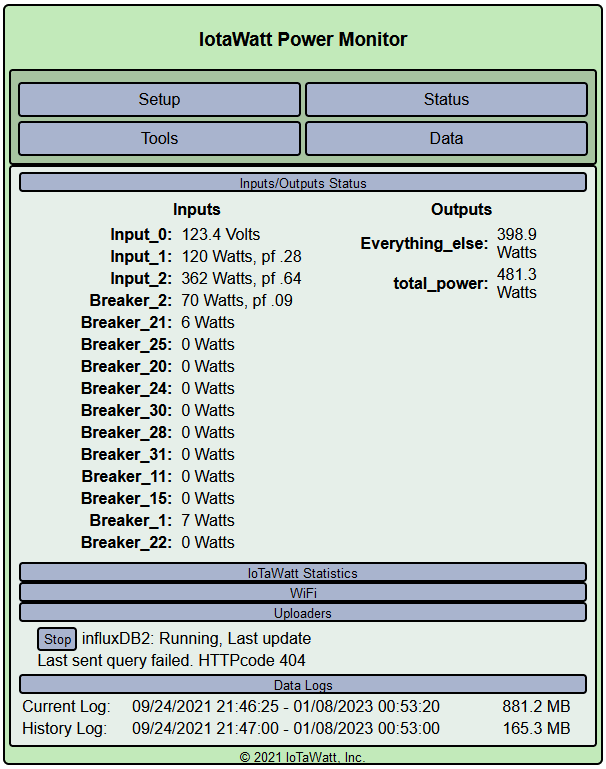
The iotawatt status page shows HTTPcode 404
I open a browser, copy the url for the influxDB server from the iotawatt data uploader setup page, paste it into the broswer, and the influxDB portal displays in the browser
It looks to me like the iotawatt doesn’t even attempt to send a message to the server, based on the wireshark log. Am I looking at the log wrong?
Note - I removed the IP addresses from the wireshark log file, and replaced them with descriptions of the device I used. The IP address for the home-server was already in the iotawatt log file…
How did you capture the Wireshark log?
Which machine is the InfluxDB server on?
Most wireless NICs don’t support promiscuous mode neither do switches (unless you have an expensive one that allow you to configure it for monitoring).
It seems odd that you are getting a 404 error as opposed to a connection error.
Docker networking is hard to get right. I always test it from a different device to make sure that the larger network path is working.
I have InfluxDB running in a Proxmox container and another version/instance running in Docker on an Ubuntu host. Both are accessible by external devices. I don’t have InfluxDB talking to the one in Docker yet, but it is working fine with the Proxmox one.
Probably not capturing transactions with the influx machine. I don’t see your browser to influx transaction. I don’t see any way IoTaWatt could manufacture a 404 response on its own.
Could this be something as simple as you influx machine’s webserver not accepting http for the docker container? Your browser may be sending your manual entry as https. Regardless, the problem appears to be the transaction being rejected.
In the context of this thread, I’m talking about the 404 response that is being reported as received from an outbound post request to influxDB from the IoTaWatt acting as a client. The user is suggesting that IoTaWatt does not send the transaction and is instead reporting that it received a 404, presumably a product of its own devices.
It’s true that IoTaWatt’s web server will also report 404 when an inbound request to the server does not specify a valid endpoint. That’s normal for a web-server and why I’m saying that its coming from the influx host.
How did you capture the Wireshark log?
Which machine is the InfluxDB server on?
I captured the Wireshark log looking for all traffic associated with the ip address of the iotawatt. Any communication between my laptop and the influx server would have been filtered out. The server is setup on an HP elitedesk. I just captured another Wireshark log looking at all traffic associated with my laptop, and traffic between my laptop and influx server was captured. I suppose this may not guarantee that Wireshark on my laptop would capture traffic between iotawatt and the server, but at least I can say the server isn’t block all monitoring from Wireshark.
Could this be something as simple as you influx machine’s webserver not accepting http for the docker container?
Good question, but I checked tonight, when I access the influxDB server via the browser using the URL, it’s not a secure connection.
Can you post your docker config for influxdb or the output from docker inspect <influxdbcontainer> and docker network inspect <influxdbnetwork>
See attached. I’m tempted to try setting up an influxDB instance hosted with Azure, and setting up a proxy server to see if that works and rule out the Iotawatt as the issue. I may try that this weekend if I can’t find the issue.
Thanks for the suggestions, really appreciate the help.
Maybe better to run a proxy server between IoTaWatt and your docker to try to capture the transaction. Also, I’d go back to one of my original suggestions to run the IoTaWatt with a USB cable from the laptop with a serial monitor like Putty. The full 404 response will be logged to the terminal.
Wireshark running on a different PC is not going to be able to see the traffic to/from Iotawatt and the ED PC, which is going to be travelling over Wi-Fi and/or a separate port on the network switch.
I would follow the suggestion of the USB terminal connection. I did that once on Iotawatt, but do it lots on other esp8266 devices.
Your docker setup looks ok. I tried to reproduce your issue. I setup influxdb 2.6 in docker, pointed iotawatt at it, and messed with some settings. The only status I was able to get in iotawatt at all was Last sent query failed. HTTPcode -4 which I’m assuming was because I didn’t create the iotawatt bucket, and also isn’t even a valid http status code. So I created the bucket and after about 15-20 minutes, and restarting the docker container and iotawatt several times, it’s still stuck at the same HTTPcode -4 message. So there’s definitely something wrong here but I don’t know if it’s a problem with iotawatt, influxdb, or something in between (keyboard and chair maybe) but unfortunately I have a day job and have to get ready for work so I don’t have time right now to dig any deeper. If i get some time later I’ll look into it further as I plan to get this working with influxdb soon as well.
As soon as I posted that I realized I forgot to add a firewall rule to allow iotawatt on my iot vlan to access influxdb on its vlan. As soon as I added the rule, the status changed to influxDB2: Running
What do you get if you run curl -I http://192.168.1.29:8086 from another machine outside that docker bridge? You should get something like this…
by the way, when I delete the iotawatt bucket, I get a 404 as well. Double check your bucket in influxdb, make sure it exists and it’s spelled the same as it’s set in iotawatt.