New Install, two IotaWatt, US Split phase panel - photos

I don’t know if this is the right place, or appropriate - please move or let me know if not.

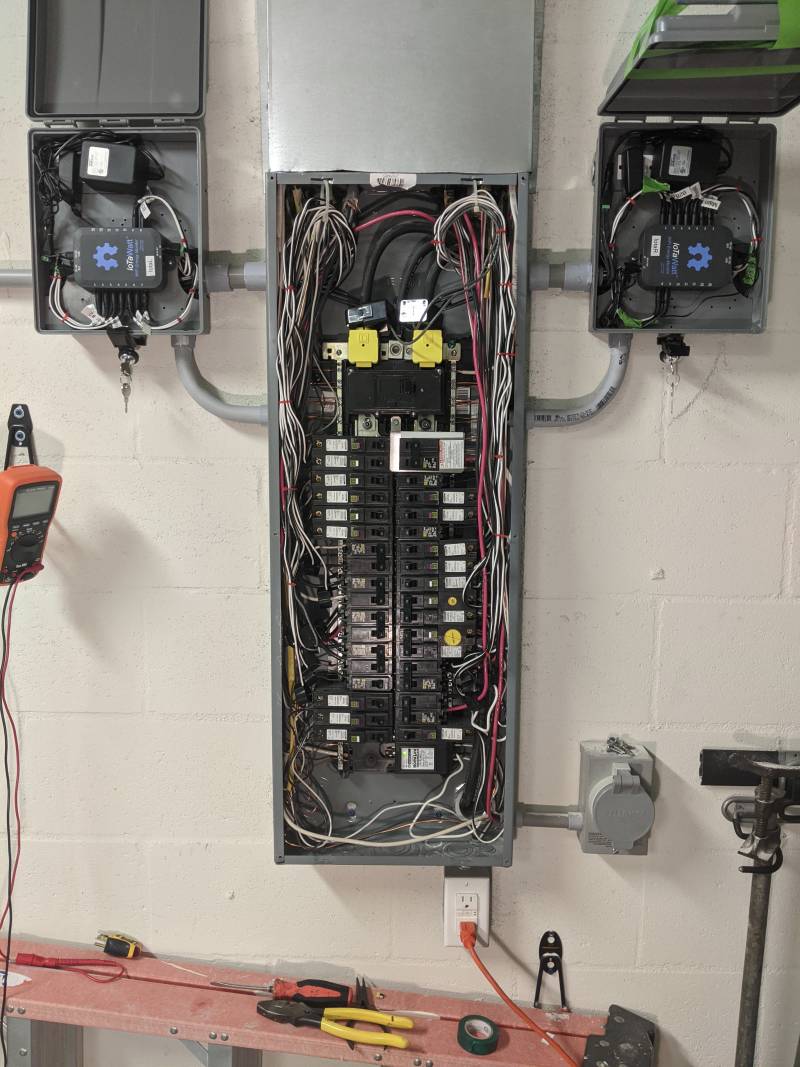
I thought I would share an in-progress, two-IotaWatt install; it might give others ideas of things to do (or avoid), and if anyone sees areas of improvements I would love to hear.

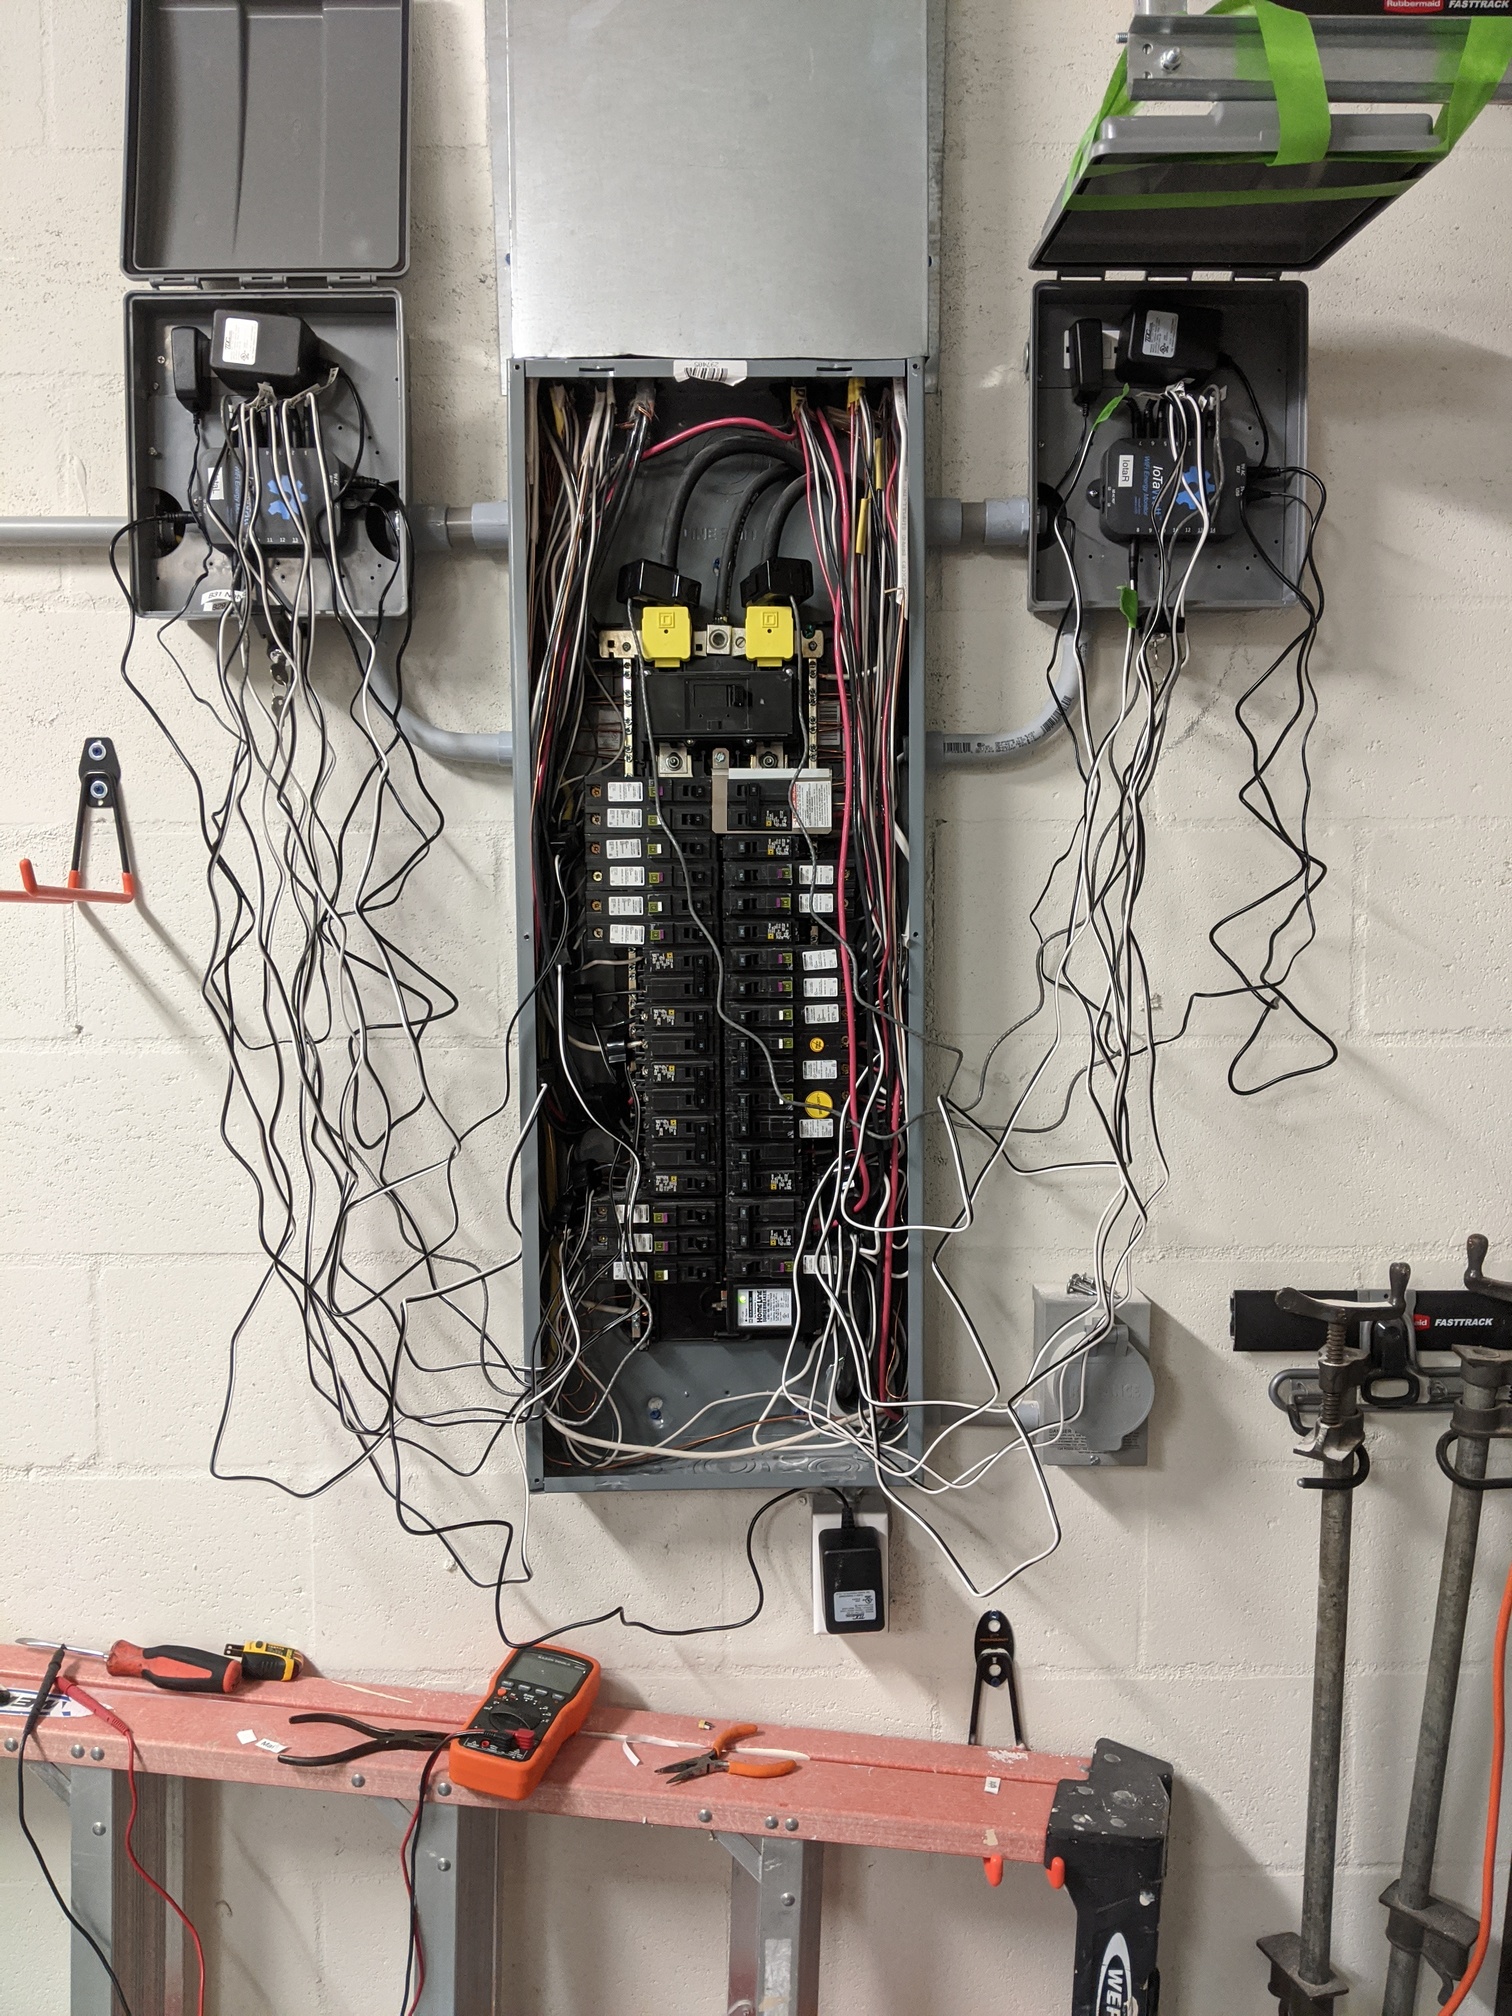
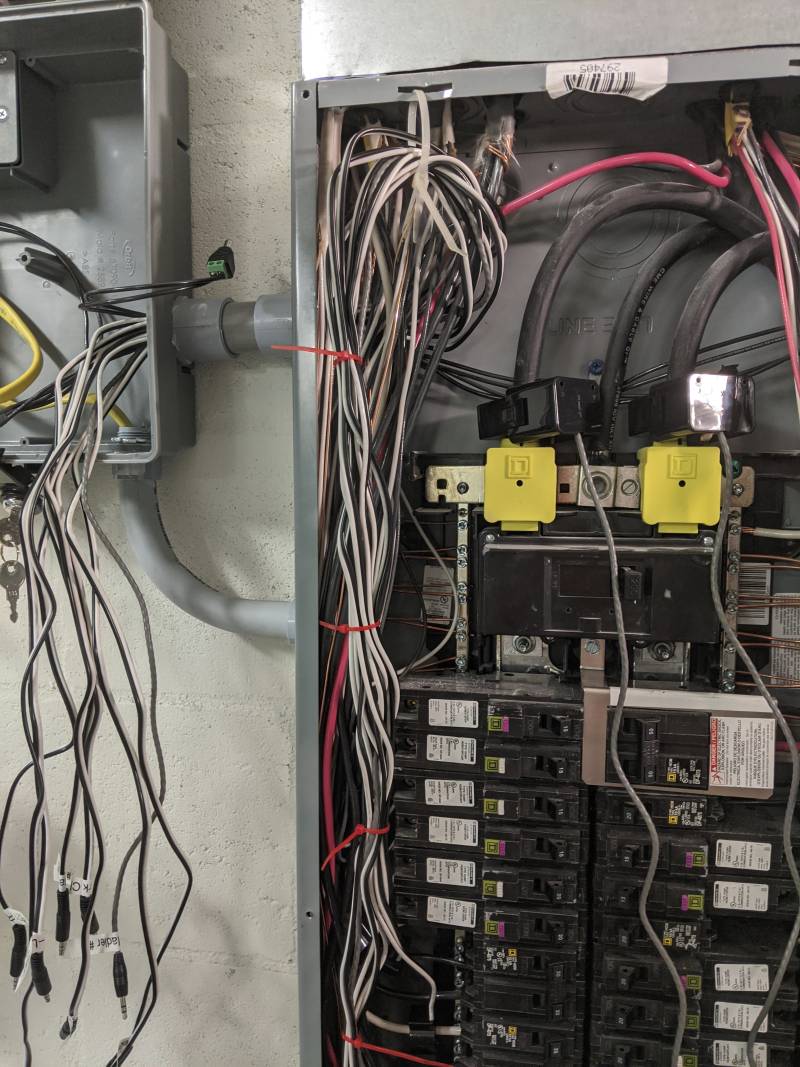
As I write this my units are in transit, so I am trying to prepare the panel. That involved removing an old TED device (which only measured the mains) and creating a home for the two IotaWatt’s.

Step one (no picture) was to move a ESP2866 temp unit I had elsewhere to the garage to make sure wifi was adequate for such a unit, since I think the Iotawatt’s are based on the same chip. Worked fine, moving on.

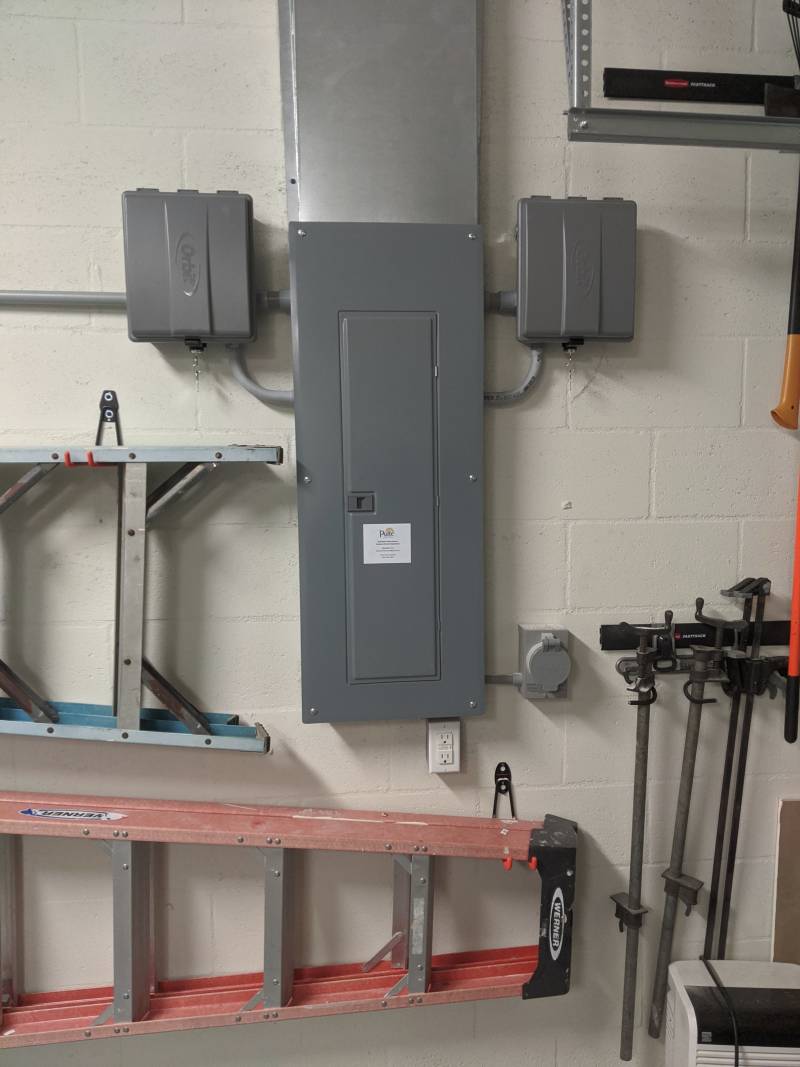
Next - thanks for postings here I knew about the Orbit boxes, so I got two of them, and mounted one on each side.

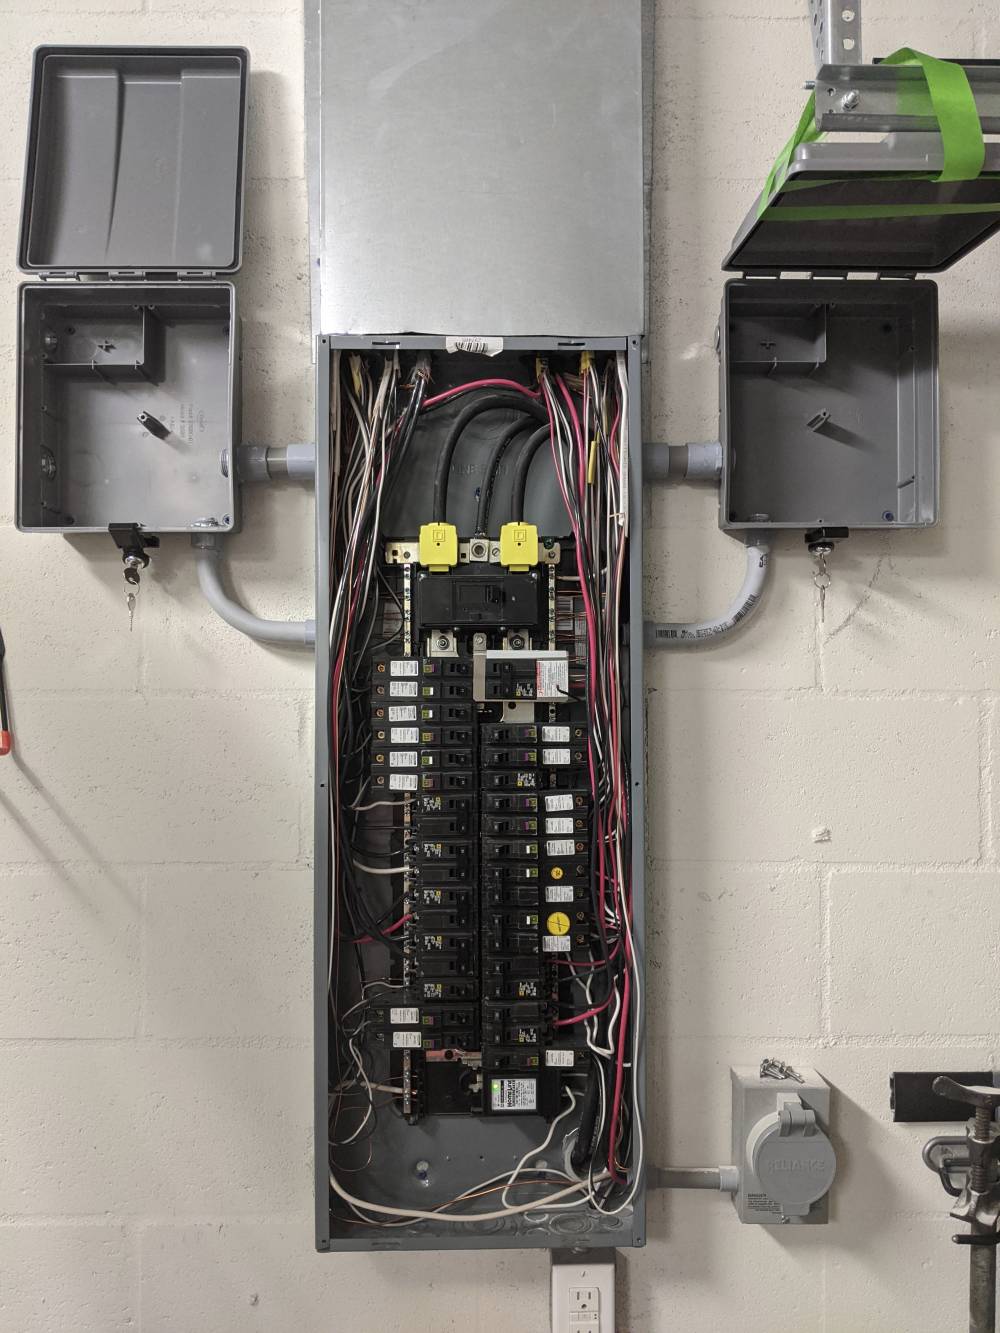
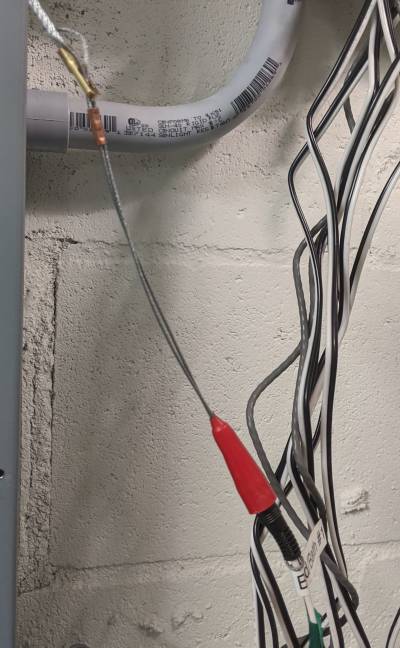
The small conduit is 3/4 and I will use it for 110V, the straight conduit is 1" for the CT’s. Hopefully large enough. The box on the right cannot open vertically all the way due to a garage door rail, a minor issue, but right now tape is holding it up.

I mounted them vertically so both could have the outlet out of the way of the incoming CT wires. This meant that I needed to make a new hole on one; actually I needed to enlarge the other hole anyway. So drills are needed. I’ll also need to cut the half moon opening in the plate as it will be on the reverse side on the left panel.

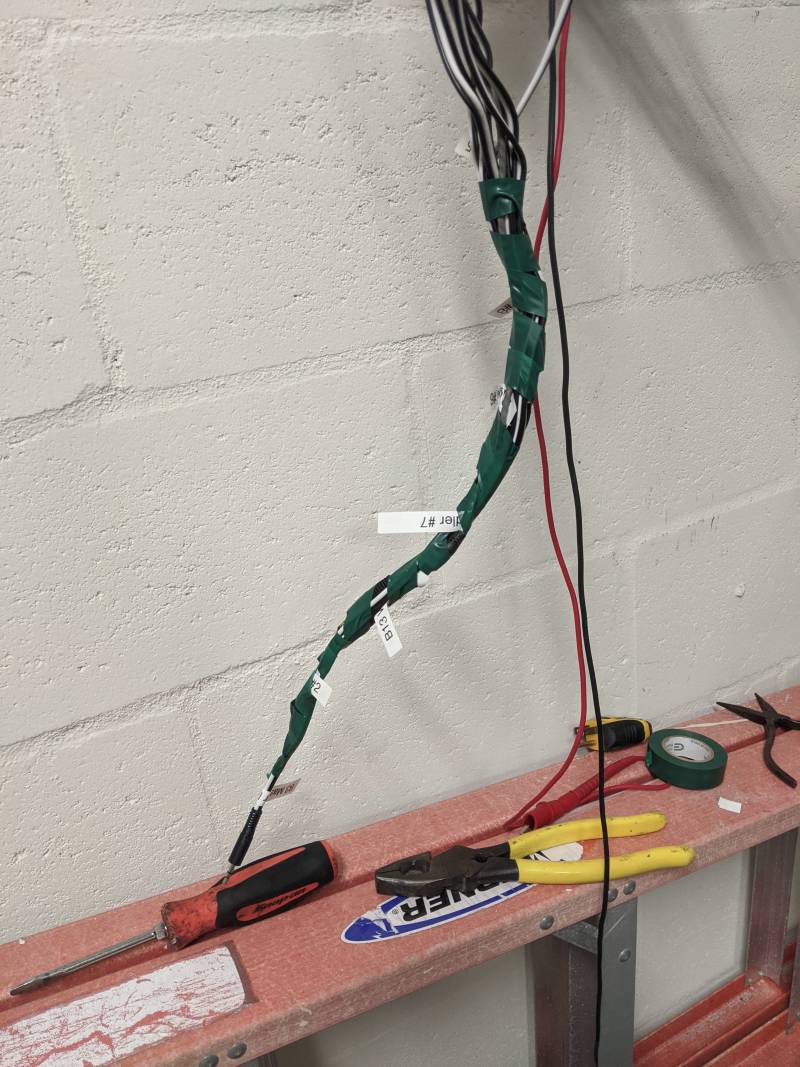
I also needed power to a nearby spot in the garage, so step two was to keep going with conduit out of the left unit.

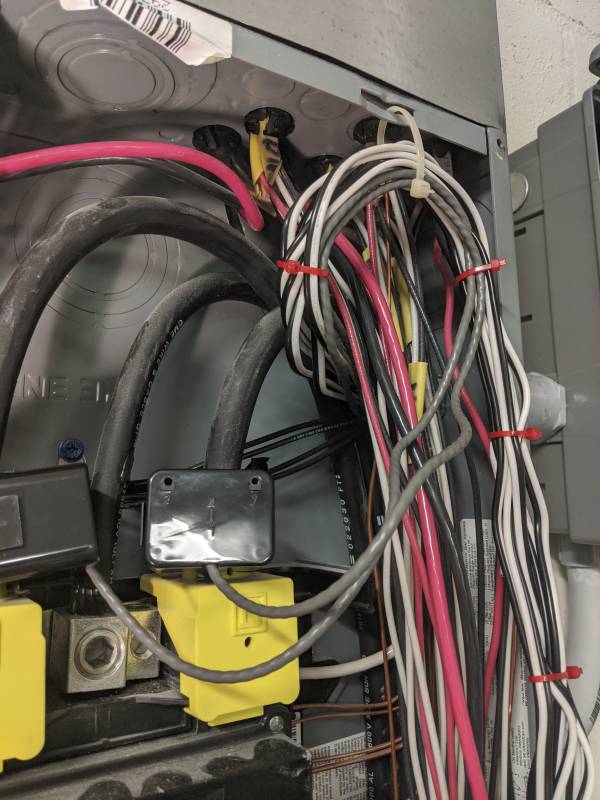
In my case I wanted these up high, as I have a ladder that would be in the way down low and generally speaking it’s easier to get access to the side of the panel near the top, above the breakers. I got an unpleasant surprise on the 3/4 entry on the right – the mains were right there against that corner. Lots of grunting and groaning prying them away to allow the connector to get in there (no sparks!)

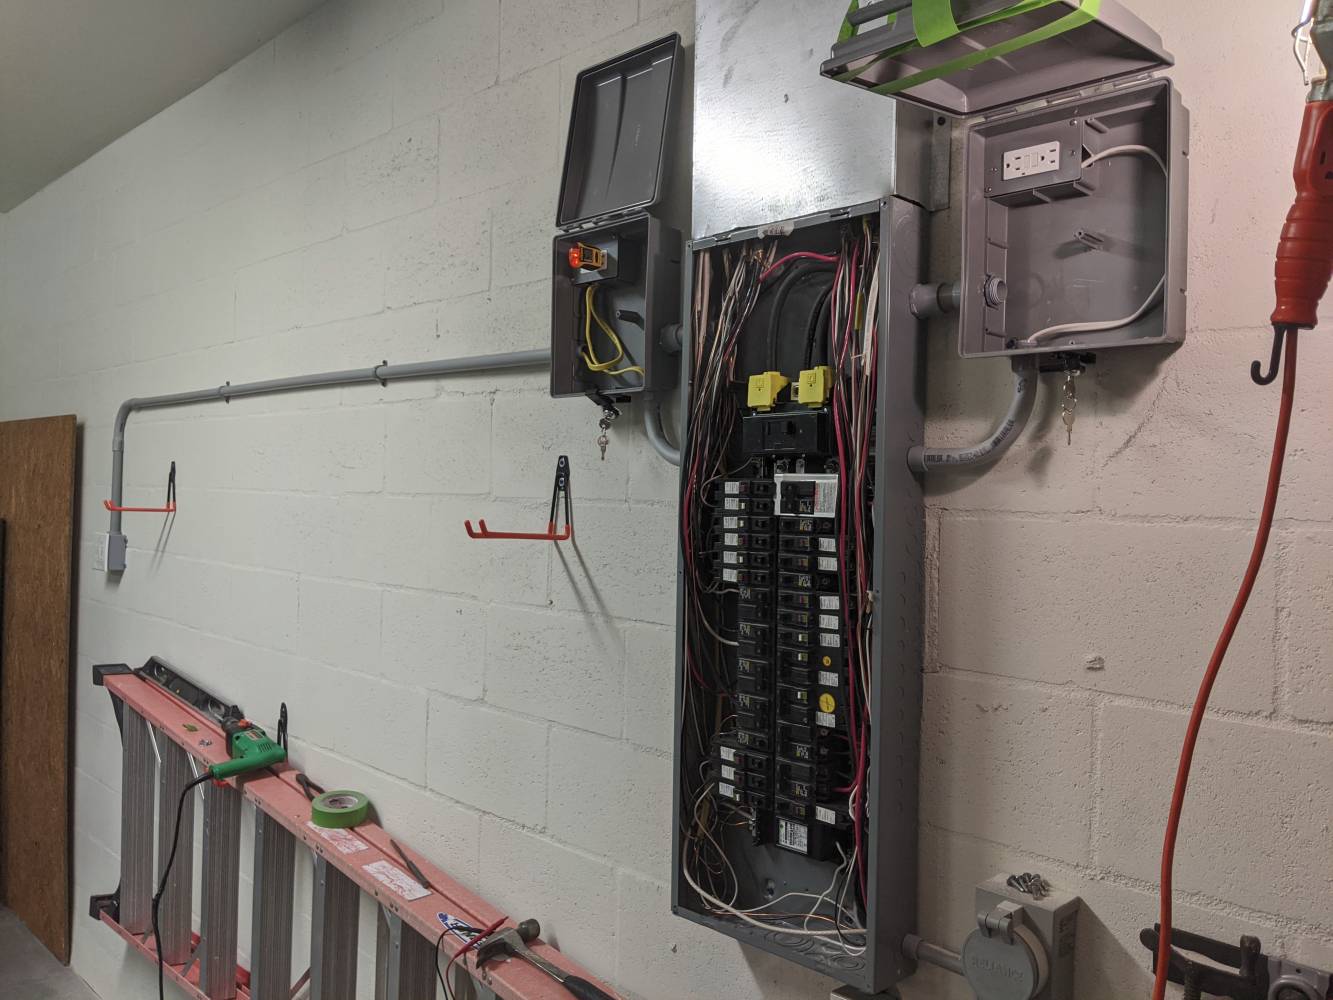
I am feeding these from two different breakers. The right is just a normal 15A breaker, and so I left the GFI in place that came with the Orbit. The left I wanted for tools, so it is on a 20A AFGFI breaker, with the outlet replaced for a 20A outlet. It’s really tight behind the outlet cover with all that 12G wire, but it seems OK. I may revisit that. Since the 110V is behind the cover on which the IotaWatt mounts, I may just move the wire nuts, etc. out of the tiny box.

So anyway, that is where I am at the moment, waiting for the unit to arrive.

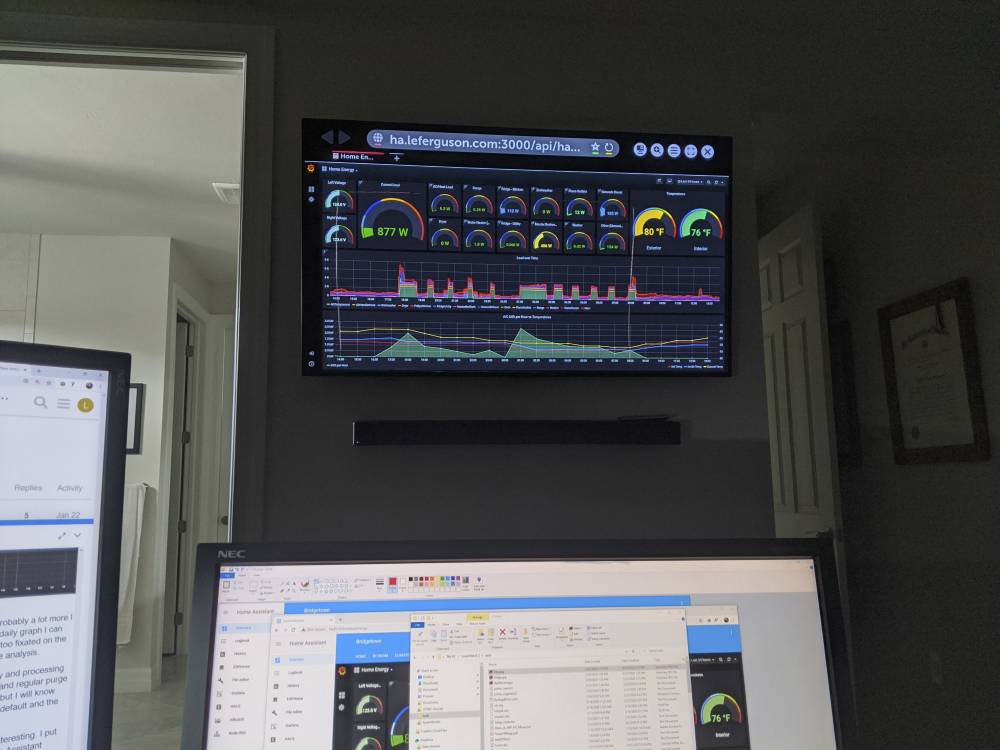
I plan to put a VT in each box, which will put them on different legs. I’m thinking about splitting it and running each to the other, so I have a separate VT for each Leg in each box. Not really needed for useful measurements, but it might prove interesting.

More news when I get my devices, probably tomorrow. Again, advice always welcomed.

Linwood

1 Like

Yep, I found it an hour or two later, and both are up and running and I’m adding CT’s now, and creating a rats nest of wires, exactly as I expected. Going to wire it all up hanging outside the conduit, and once working and finalized stuff wires away. More once I get everything connected.

So this next photo may be scary, but it actually should be encouraging. I unpacked the device about 3-4 hours ago. In that time I managed to configure both devices, and install 17 CT’s plus the voltage reference.

One of the longest thing was making labels for everything; highly recommended. I put the breaker number and port number on them.

Then I decided to NOT run any of the cables yet through the conduit. It seems like it is easier to clean them up all at once, once I make sure everything is working.

So working breaker by breaker, with no shocks and no tripped breakers (actually a bit amazing), all the CT’s are on and verified to be getting readings (and in a quick glance all looked like sane values).

Amazingly straightforward. Don’t be put off by all the hanging wires, it’s been ages since anything in the automation world actually worked out of the box so simply. Note I have a LOT to configure and integrate, not saying it’s all done or all perfect, but pleasantly surprised.

Other than the suggestion to make labels - one thing I did that helped a lot is I put all this on a spreadsheet first, which circuits had what on them, what CT I would use, what IotaWatt (easy as one is odd, one is even). Then I could use that spreadsheet for labels, for setting up inputs, and then as I put in each CT it had a label already with the breaker number and port number so everything would match.

Here’s what I can see so far:

I need splitters and going to set up the polarity and vRef differently next, then do some testing to make sure I really am getting reasonable readings (e.g. I really am around the right wires everywhere)

Tomorrow. Food next.

So now it’s time to get the voltage references done. I am (for reasons educational not practical) trying to get each leg’s voltage tied to each load, and I want to pass the reference transformer’s voltage across the panel to the other side (each low voltage box is on a separate leg for 110v).

Nothing is ever simple. Never start off thinking “oh, this is easy”. :thinking:

I had a bunch of these from some LED lighting projects, and amazingly their screw connectors were just the size for #14 THHN cable, which has insulation matching what’s required in a panel:

First problem is I had only black wire. Check local home depots and lowes - same thing. Sigh. OK, so after careful research I find electrons really are color blind, and use black for both legs. Good to go, heat shrink around the join… pretty (very stiff and awkward, but it’s #14).

And… my connectors are really, really loose in the Iotawatt. Break out the drill bits (best way to check 2.1 vs 2.5) and they are the right diameter, it’s like they will not go all the way in. But they work. I may have to revisit that, see if I can find some that fit better.

So now for each leg I have three voltage measurements, one from each Iotawatt, and one from my meter.

On the good side all are close enough for any practical needs, but now I have to work on how to reconcile the calibrations.

Anyone following along at home who wants to just get things running – just don’t do any of this… These steps are definitely for those who make sure installing outlet covers the screw slot all line up. You know who you are!

You don’t show the data statistics with average voltage in those screenshots, but it looks to me as if the blue trace (left) is exactly the same, and the green trace (right) is about 0.25V different between the two. To put that in perspective, my Fluke 175 “true rms” meter is rated at 1.0% of reading + 3 counts (0.3V) or +/- 1.5V at 123V. These two IoTaWatt agree with each exactly in one case and +/- 0.25V or 0.2% of reading in the other. I don’t think it gets any better than that.

The resistors used in those voltage divider circuits are 0.5%. I used a three way splitter to input a single VT to all three voltage inputs. They vary by less than 0.1%

2 Likes

Oh, yes… they are really close. Really close. What I plan to do is get the two IotaWatt’s to match exactly for the same reference (whether it will be accurate or not is a different question).

Right now I’m starting to dress up wires. And Murphy struck – I didn’t see the black main in the dark corner of the panel that’s right in front of the 1" conduit I put in. :cry:

Well, I wanted something to work on instead of March Madness.

Still going. Hopefully one day someone will get something useful from this.

Decided to clean up the left side first.

To pull these through with the connectors already on them I stagged them and wrapped lightly in electrical tape.

Pulling it with fiberglass tape (seems silly with about 6" to pull but, well, first lesson in civil engineering is “you can’t push a rope”; electrically it’s “you can push a wire but it will get stuck”. Unfortunately the pull tape add-on is metal, so a bit scary up there around the mains. Be careful!

Once they were through I pulled them up mostly even, hung from the top of the panel so there was a bit of separation, and got them into the box.

And here’s the first draft. I decided to put cutouts on both sides of the orbit plastic floor, so the wires are not quite so cluttered coming out. The big 9V is … well, big, and I will likely clean up the wires a bit more. (If the box was 90 degrees at least it would hang straight.) I’m trying to be good and not put the class 2 stuff under the plastic. This can be cleaned up a bit, but it shows it is usable.

In retrospect, two suggestions: 1" is tight, if you have lots of CT’s, make sure it’s really clear to get to the conduit in the panel and maybe consider 1.5" (though that would be a bit harder to connect to the Orbit, and on my panel there were no 1.5" cutouts anywhere handy.

I’m screwed by the first of those, the 1" on the other side is partially blocked by the main wires coming in. Pulling through that is not going to be fun. Going to tackle it tomorrow. might even resort to lube, though I hate the mess that will end up making.

1 Like

For the vast audience at home waiting with bated breath for an update…

I decided to tackle the tight corner where the mains partially blocked the conduit. Wrapping with electrical tape, didn’t need lube, a bit of yanking on the right main to make a gap and… it all went in.

So here’s the final setup open. I may dress the wires a bit in the boxes, and I ran out of label tape so I need to replace those green frog-tape tags with labels, but it’s all in, and not nearly as scary as when all the wires were hanging loose.

And if you shut the panels, it just looks like I have a lot of sprinklers.

Now my car can finally go back into the garage, and I can start the sitting-at-desk phase of this.

Seeing as I am in florida, a part of me wants to somehow paint the boxes so this becomes a giant Mickey Mouse. But I’ll resist.

3 Likes

To continue the tale, I am now in software mode. I’ve had to learn about Influxdb and Grafana, and how to tie them all together in Home Assistant. Here is the result:

Unless someone really wants it, I will spare you all the configuration details, but here is the short version:

  • Home Assistant tracks other sensors, like my thermostat, outdoor temperature, etc.
  • I have Home Assistant pass select data into InfluxDB
  • Iotawatt (both of them) send Watt data frequently (once a minute) to the same InfluxDB database; I use the CT name as a tag so each is a known thing.
  • Note since I have two IotaWatt’s, I cannot calculate the “unmonitored” circuits as an output, I have to do that in InfluxDb (relative to the reading on the mains)
  • I use the Integral function to produce energy from power readings over time, aggregating it hourly (later I’ll redo the retention setup to get rid of the minute-by-minute data after a week or so)
  • I roll the data up variously in hourly and daily totals, with the right time zone to coordinate to local midnight cutoffs (by default everything is UTC)
  • I created an energy dashboard in Grafana. I have no idea what will be useful in the long run but took a shot, including last minute values (gauges at the top), a variable display of all the circuits and main (heavy ready line) on the next panel, that I can look at different time scales, and then some 2 week windows into key stuff like total energy, dollars, etc.
  • I set up Grafana inside Home Assistant, but also allowing direct access, so I can if desired show it without login on a TV or other device, or (as shown here) in an iframe inside Home Assistant.

Now I need to accumulate some data for long enough to see what becomes interesting, but I can see uses already.

Today for example I forgot to turn my oven off after breakfast. I noticed it at dinner time. Now… I can pull the data into Home Assistant and do a calculation of how long that device was on (above some threshold), and announce on the google speakers if it is on longer than X hours (or whatever criteria I want). This kind of verbal announcement is relatively non-intrusive, while being very effective, much more so than (say) an email or text, though I could send that also. Indeed, if I put a bit more effort in, Home Assistant would know if I’m in the house or not, and decide how to notify me, I just have not bothered yet.

I’ll leave off here unless anyone has questions, but kudos to Overeasy for an easy to set up device that, so far, looks quite accurate (I’m under a percent on 2 days compared to FPL), and with Home Assistant gives me a lot of options.

You’re moving right along here. Very nice all around.

So I can see you need to be kept constructively occupied. Give some thought to adding something to the project. It needs more user interface capability. Adding to the docs to explain how to pull with HA. would be a start. I know there’s some stuff in the HA forum, but maybe some generic script could be made available for download?

It needs more user interface capability. Adding to the docs to explain how to pull with HA. would be a start. I know there’s some stuff in the HA forum, but maybe some generic script could be made available for download?

One of the things I confronted (it began a bit even before data from Iotawatt) is that HA, out of the box, is not a terrific tool for large amounts of varying types of data (e.g. I have an outlet strip that I really want to just control via ZWave, but it was sending tens of thousands of measurement points a day into the database, I discovered only after it grew a lot). It takes pretty much anything you throw at it, but it is awkward about aggregation (and not terribly sophisticated), and pretty limited about retention. That’s why I switched to Influxdb as an intermediary.

But the result, coming from an old school, scripts and programs world, is heavily GUI setup oriented in lots and lots of places. Most of my scrounging around was to work through things like how one sets the config file for anonymous access in Grafana when it’s in a Docker provided by a 3rd party add-on to Home Assistant. It’s there, it works, but it is a subject that stands halfway in between and so hard to find.

Let me think about your question a bit… I’m wondering how one shows that without it being too installation specific. I also want to work on the pull side a bit, right now I’m just feeding InfluxDB and reporting from there with Grafana (i.e. HA is just a display), but I want to pull a few things from Iotawatt into HA (whether direct or through Influxdb) and actually have automation react to them. Once I see how all the paths work, I’ll try to post something.

There are others who have done that. I think their efforts can be found in the HA community forum. The older use the status API and the more recent use query. I recommend query for a variety of reasons.

In terms of alerts, there are also capabilities within the influx TICK stack to do alerts and such.

In terms of alerts, there are also capabilities within the influx TICK stack to do alerts and such.

Yes, but to really get it integrated into the automation side (not just alerting) relevant (probably already processed) data needs to get directly in HA. Plus there’s lots of good reasons not to spread alerting around on different platforms, makes it harder to test, or to notice if something goes wrong (e.g. an email setup stops working, maybe because I forgot to change 1 of 12 different places the password is stored :grimacing: )

But… to the original note … yes, I guess I have plenty to stay busy with while locked in.

I thought I would add this as it shows some of the options one has. This photo

Is two browser screens, the black background is part of a Grafana dashboard that shows total load in KW. The other two guages are quick and dirty ones in Home Assistant, one showing the same thing data pulled from InfluxDB by Home Assistant, the other is a pull by Home Assistant directly from Iotawatt.

So three paths, same data (different values are rounding in the first case, and time frame in the second).

To give a flavor of what’s involved here’s the Home Assistant configuration for those last two pulls, this is from InfluxDB:

  - platform: influxdb
    host: localhost
    username: user
    password: pass
    queries: 
      - name: Latest Main Watts
        unit_of_measurement: watts
        measurement: watts 
        group_function: last
        where: '"ct"=''Main'''
        field: 'Watts'
        database: HA

This is a direct pull from IoTaWatt directly:

  - platform: rest 
    resource: http://192.168.132.137/query?header=yes&select=[MainWatts.Watts.d1]&begin=s-1m&end=s&group=all
    name: IoTaWatt
    value_template: "{{value_json['data'][0][0]}}"
    json_attributes: 'data'
    device_class: power
    unit_of_measurement: "Watts"
    scan_interval: 60
  - platform: template
    sensors:
      iotawatt_main:
        value_template: '{{ state_attr("sensor.iotawatt", "data")[0][0] }}'
        unit_of_measurement: Watts
        device_class: power
        friendly_name: Iotawatt Main

This is wordy, but I hard coded it to make it more clear; there are examples of doing this with templates which just pull all the data directly, e.g.

https://community.home-assistant.io/t/adding-iotawatt-problem/150890/18

It uses loops to pull lots of data and build sensors for each (I have not tried the code there but it looks reasonable).

I wanted to see all these work, but my thinking is to always have Home Assistant pull from InfluxDB, and not direct, and let InfluxDB be the repository, handle retention and aggregation, etc. Or in my case it can combine data from two IoTawatt devices (e.g. calculate the “other” that is not monitored by summing all from both and subtracting from the mains).

But it’s nice to see how easy both are to get to work.

1 Like

As I work through this will offer a bit of a cheat sheet for those who might stumble across this thread.

The InfluxDB database output is well documented, but if you are not familiar with it (say, as me, coming from more traditional databases) it may be confusing. There’s also a confusing terminology on the webs server setup screen. Finally, I have two Iotawatts, and it took a bit of trial and error to find what worked in terms of setup so I could combine their output downstream easily.

I built a cheat sheet that has the Iotawatt setup on the top, and a command line interface output at the bottom.

The first thing to know is that InfluxDB has some serious limitations that will not come naturally to traditional database users: (1) it will not allow math (etc) across “measurements”, only within a measurement (it does allow it between fields and differently tagged data with some caveats), and (2) you will see it easily does rollup aggregation on a automated basis, BUT you cannot create new data with new tags.

This last one is a bit obscure; I have an ACCompressor (outside circuit) and AirHandlerHeat (inside). Each is identified by a tag (whose value are those names). I wanted to create a similar measurement with a tag of simply “AC”. You cannot do that in InfluxDB – you can add them together in a query, but not save the data with the new tag (you can save it untagged, even as a new measurement, but if you are using tags to identify circuits (and the like) this breaks your model.

Using measurements instead of tag actually makes it worse – then you are even more restricted.

You can output it from Iotawatt of course, added together, provided both items are on the same device. However, there is a bit downside from doing that, or put another way, there is a convenience if you send a given data item only once – if you then do SUM() against them collectively, you are not double counting them.

So here’s what my setup looks like:

It’s useful to follow the colored arrows.

RED is what the measurement name becomes in Influxdb – that is from the text box at the top – do not be confused by the “measurements” section which is subtly different (I wonder if something like “outputs” might be mess confusing – these produce measurements, but nothing in that section is specifically a Measurement per Influxdb). What ever you put in the Red box becomes the thing on the left if you say “Show Series”. In my case I make it the $Units, which in turn produces two measurements – Watts and Volts (as those are the only units I send). Notice on the left side in the CLI – that “Watts” is from the input box.

Now look at the BLUE arrows. I have defined those as $name, and these map to the “measurements” section names (think “InfluxDB Outputs” not “Measurements”) like “ACCompressor”. Notice they are referred to in the Tag section, which in turn produces a tag on the series beside the actual Measurement name (red). So in the output of Show Series they are of the form “Watts” (from red above) and “ct=ACCompressor” as a tag and can be used in the where clause in queries.

Now look to the Green line. The Field-Key becomes the Field Name in the data. In my case (magenta bracket) I have units that are both Volts and Watts, and if you follow them up to the Field-Key where $units is used again, it flows into the data as shown in the two select statements. This does not need to match the Units, it could simply be “Value” if you like – but it seemed to make sense to show the name as the units.

I used $units in both the measurement and field-key, so I get the same name in both places, but they are very different. Measurement is a grouping, and strongly isolates data. If for example I had used the IotaWatt’s device name there for Measurement (e.g. putting in $device in place of $Units in the Measurement input box), I would get two separate groups (red arrow), both of which would have field names of Watts – but I would have great difficulty combining them together properly. Influxdb will do nothing much at all between Measurements, so pick that name most carefully.

What I wanted was to make this look, as much as possible, like it all came from one IotaWatt; that makes reporting on it easiest. I can always tell by “ct” tag which device it came from if debugging.

The result of all this is that my database now has per-minute data (the 60 at the top), updated every minute (same times bulk send number = 1).

Now I’m working on aggregation and presentation. More later.

I’ve got two IoTaWatt in my home. One is out at the meter and measures the mains at the meter, and also the mains of a panel in the outbuilding where the meter is. The outbuilding has some loads in the summer, but this time of year the only real load is a sewage pump that runs a few times a day. The other IoTaWatt is in the house and has mains as well as circuit breakouts for the house 200A panel.

I’ve never tried to aggregate these two, but @Linwood has inspired me, and I have a new install of influxDB with grafana. So I’m taking a fresh look at the problem. My motivation is that there really needs to be some R&D into how to do this if multiple units are to be a viable solution in commercial applications. I’m presently toying with a different approach.

Here is the setup for each of the units:

You can see that I am using $units for the measurement name, and $name (the output name) for the field-key. There is one tag-key “iota” and each of the units have a different value for this tag. This produces extremely low series cardinality. There are just three series:

Volts,iota=units
Watts,iota=units
Watts,iota=main

Basically, there will be a series for each unique units/iota combination. I believe this is well suited to the kinds of retrieval I will be doing. Reference the influxDB schema discussion and specifically:

Now the goal is to be able to use the measurements from different units in the same calculations. To demonstrate using this schema in a calculation, I took the iota=units and computed the “other” with a formula in the influx query and plotted it with the other that was computed by the IoTaWatt:

They are the same. I added 5W to the influx computed value so it would be visible, otherwise it completely disappears behind the other other :grin:

I couldn’t figure out how to do the calculation with grafana’s menu based query interface, but I was able to type in the query that you see. Actual;l, the menu produced the template with the tags, group, and time.

So then I moved to the two IoTaWatt scenario. The iota=main unit measures the mains and the subpanel, called GH_main here. It’s a basic Y so meter should equal GH_main + total_power (the house panel mains). Subtracting total_power from the meter then yields the usage by the GH_mains. Here is that computed value, plotted with the directly measured GH_main:

If you look close, you can see some green traces here and there caused by the voltage drop in the mains cable running underground to the house when the water heater ran. It caused the power to be undermeasured compared to the same current going through the meter, hence the slightly negative difference.

I think this is a good way to handle multiple IoTaWatt.

First because it keeps cardinality low and should be more performant.

Second because this could result in more efficient influxDB uploads if IoTaWatt combined all of the values for each unit into a single line.

Last, because if used in a commercial setting where various groupings may be needed, the tags can be used. For example, lets say that units were in each building on several different college campuses.

All of the units at each campus would have a tag equal to their ‘location’ i.e. Boston, Lowell, Amherst. ‘building’ might be dorm or gym or library etc.

Now if you wanted to see the total power used in each branch’s library, you could do that. Same for dorms. If each building had fields for AC or lighting or HW, that could be broken out by campus, or building type or both. Moreover, if fields for various individual AC units were labelled AC01, AC02, or ACwhatever, they could be viewed individually, or aggregated using regular expressions.

Does that make sense to anyone?

So this document, which I had seen, is why I did the reverse. :slight_smile:

To make sure I understand, what do you get from this:

select * from Watts order by time desc limit 10 

Do you get a row with lots of filled in fields, or separate rows by circuit and all but one field null? I assume the former, and indeed that dramatically reduces cardinality.

You will, I am sure, at least get a separate row by IotaWatt because of the tag.

There are two places I think this is needed, one is in dynamic queries, e.g. from Grafana, as you have demonstrated. What I’m working through though is how to consolidate and aggregate data over time; I do not think it is worth keeping minute-by-minute data for more than a week or two (one might argue not even that).

So I’m doing things like this:

CREATE CONTINUOUS QUERY kWh_per_hour ON HA RESAMPLE 
    EVERY 20m FOR 2d 
        BEGIN 
            SELECT integral(Watts, 1000h) AS kWh INTO HA.autogen.kWh 
            FROM HA.autogen.Watts GROUP BY *, time(1h) 
       END

(Indentation mine to make it easier to read).

This creates a new measurement rolling up Watts to Killowatt Hours, and because I use tags for circuit the “*” in there preserves all those tags. Once I get this right it will have a different retention (not autogen).

In your case this would work similarly, I think, you just need a whole string of integrals in the select with separate “as” names.

Your approach does imply hard coding of these field names in such queries though, whereas mine is dynamic. This becomes relevant on larger installs as you might add new circuits or new IotaWatt devices. These are not just in the continuous queries but in the Grafana queries as well, in some places, e.g.

select sum(mainWatts) - sum(measureWatts) as otherWatts from 
    (select sum(lastWatts) as measureWatts from 
        (select last(Watts) as lastWatts from Watts where ct<>'Main' group by ct)),
    (select last(Watts) as mainWatts from Watts where ct='Main') 
group by *

This calculates the “other” or un-monitored circuits as the difference in the Mains and the monitored circuits (which are coming from two IotaWatt devices). The third line shows what I’m talking about - it will handle any number of circuits from any number of devices, as all it cares is “not Main”, and it can then sum them all. To do this with fields as circuits you would need to hard coded each one in the math.

I have all of a couple days experience with influxdb, so I really have no idea if the smaller cardinality you are probably getting is more helpful than the… maybe extensibility is the word… of using a tag for the circuit names.

But I am sure glad you brought it up, as I had not even considered it.

To your discussion of larger installs, if we are talking InfluxDB and Grafana, one approach if you do find the lower cardinality is worth it, is to write some automatic scripting. It would be very easy to generate the continuous queries for aggregation automatically, even the json for a basic Grafana dashboard.

Where I think this because difficult is for users who do their own dashboards and have a lot of hard coded field lists (e.g. in sums or subtraction) and then add a device or circuit, they will struggle to find all the places to adjust (well, unless they are comfortable editing JSON in text editors. Even that could be painful.

Incidentally, I wonder if it might be useful to allow different measurement names for included circuits. E.g. a Main and then branch circuits are in some ways fundamentally different in that they should not be added together in sum() stations for a group by, so I have a lot of places that exclude them. If the upload to influxDb allowed the measurement name to be per output instead of overall, InfluxDB’s aggregation would by default aggregate only within the same “level” (for want of a better name), and you can (in Grafana) do math between, but all data rollups in continuous queries would auto-magically not include items at different levels. For example you might have service entry as one level, building as another, panels as a third, and then branch circuits as a fourth. Having separate measurement names would implicitly keep these separated.

Random late night thoughts for what it is worth…

A follow up. I’ve been working off and on with influxdb and how to set things up. I am (for now) staying on the opposite course as @overeasy above, and sending circuit name as tags.

So what I did was design a set of retention policies for increasing levels of aggregation. For now I have:

name    duration   shardGroupDuration replicaN default
autogen 528h0m0s   168h0m0s           1        true
hourly  1800h0m0s  168h0m0s           1        false
daily   26400h0m0s 168h0m0s           1        false

That’s 22 days, 75 days and 100 days. So minute by minute data is saved for about 3 weeks (I’ll likely reduce that at some point). Note “autogen” is the Inflexdb name for “computer generated default”. You can change the default to something else, but this was just as easy, to use it (leave the corresponding field blank in the setup you get the default, and if you don’t change the default in Influxdb it is “autogen”).

That data is aggregated into hourly totals and kept for a bit over 2 months. In turn that is aggregated into daily data and kept for a bit over 3 years.

I then created continuous queries that looked more or less like these:

CREATE CONTINUOUS QUERY kWh_per_hour ON HA RESAMPLE EVERY 1h FOR 2d BEGIN SELECT integral(Watts, 1000h) AS kWh INTO HA.hourly.kWh FROM HA.autogen.Watts GROUP BY *, time(1h) END
CREATE CONTINUOUS QUERY kWh_per_day ON HA RESAMPLE EVERY 1d FOR 3d BEGIN SELECT sum(kWh) AS kWh INTO HA.daily.kWh FROM HA.hourly.kWh GROUP BY *, time(1d) TZ('America/New_York') END

The first does the hourly aggregation, the second the daily aggregation. It’s important to adjust the “tz” time zone as needed to get the right cutoff for days at midnight local.

This allows me to have different flavors of graphs, from short term very detailed ones (for 22 days) to moderate term hourly (2 months) to many year day-over-day comparisons.

Influxdb takes care of purging old data as needed based on the policies, and just changing the policy is all it takes if you want to keep some longer or shorter.

There are some quirks though, that are worth mentioning. InfluxDB does not let you schedule these queries beyond what you see. So when I say “every 1h” (1 hour) it runs at the top of the hour. There are two problems with that, (a) now all the data for that last minute may be there yet, in fact almost certainly is not, and (b) it does NOT summarize for the period ending. My guess is (b) is to allow for (a), but it means that you are always a period behind. So at 11:30am you have data through 9am, not through 10am; or on April 24 you have data through April 22, not April 23.

You can manually run the commands to bring it up to date, and these could be scripted outside of influxDB to run off schedule (e.g. 5 minutes after the time), but I have found no way to do it inside of InfluxDB (note the time shift functions also shift the periods).

Also note I have it resampling and overwriting data; this is to handle “normal” cases of missed data, e.g. network down, computer down, etc. IoTawatt will buffer, then dump several minutes, hours or even days at once; the resample will then merge it in. If it’s longer than the resample I just have to run the statement by hand (without a period selected it does all). If you didn’t know - Influxdb will only allow one row per timestamp per distinctive criteria (tags, etc.) so as new data comes in it does not try to figure out what was there, what wasn’t, it just recalculates everything and writes it – if already there and the same it stays the same, if different it updates (overwrites), if missing it creates.

Anyway… what I ended up with are graphs like these:

The top portion is (near) real time data for each circuit, plus temperature for reference.

The next two are recent data plots over time, and you can adjust the period (up to the maximum for the “autogen” or default data to show reasonably precise power (the Load Over Time) and since A/C is my biggest piece the A/C load by hour along with temperatures. This is good for the period of the grap.

Finally there are two fixed-length graphs at the bottom with daily energy usage and daily A/C usage.

The top real time gauges link to an analysis page for whatever you click on, e.g.

The above is my fridge. There’s probably a lot more I can add later to this one, e.g. the daily graph I can also put a dollars scale. I’ve been too fixated on the mechanics to think much about the analysis.

A clear issue in all this is cardinality and processing time as the data builds. The rollup and regular purge is intended to keep it manageable, but I will know only after I start getting at least the default and the hourly “full”.

Now what happens next is kind of interesting. I put them first into an iFrame in my Home Assistant dashboard. So for example:

I can click there and up comes the dashboard above. But I can also say “Hey google, activate show energy in bedroom”:

My LG TV calls up the Grafana graph and displays it.

Please do not ask my WHY I might need that, but it will really confuse visitors (it could be the Living Room or Den TV of course).

Incidentally that’s not just an image, it’s a live graph, and you can use the TV remote to select/change things like drill down or period covered.

I’m sure eventually I will find a good reason for it, in the meantime it’s kind of a cool solution in search of a problem. :smirk:

2 Likes

Nice project. Same basic theme as whet I was doing except I didn’t follow through with a HA setup. There are some technical issues raised here that I tought I’d comment on:

The IoTaWatt current log and history log are the same basic setup. Current is 5 second and history is one minute. The way the IoTaWatt is setup, it would be trivial to add an hourly and daily, but it’s not really necessary as IoTaWatt doesn’t need to integrate or sum to get the kWh or average Watts over any time interval. Just a function of how it keeps the data.

When I setup my version, I used RPs to limit the duration of each category, but took a different approach to the CQs. To aggregate the one minute data, I use

RESAMPLE EVERY 2m FOR 1m (minute downsamples)
RESAMPLE EVERY 2h FOR 1h (hour downsamples)
RESAMPLE EVERY 2d FOR 1d (day downsamples)

This solves the currency problem (pretty much) but doesn’t do much for the problem of historical data upload. That’s a real problem and I can’t find a good solution in influx. There are several threads raising this issue with influx, and their two solutions are:

  1. What you are doing, oversample and keep rewriting the old data.
  2. Use Kapacitor.

Your solution is only as good as the lookback window, and while the influx folks may think it’s a great solution on an AWS server, it might not scale down to a RPi very well. At a minimum, I would be concerned about potential wear to the SDcard if the activity causes rewrites.

I looked into Kapacitor, and while it’s a pretty elegant way to setup nodes and pipes, I couldn’t see a way to easily do this.

I’m currently considering writing an external chron task that would submit downsample queries.

Slick.