Thank you for making available this monitoring solution. Works great. It would be great if somebody could help me interpret the following correctly.
See screenshot below…
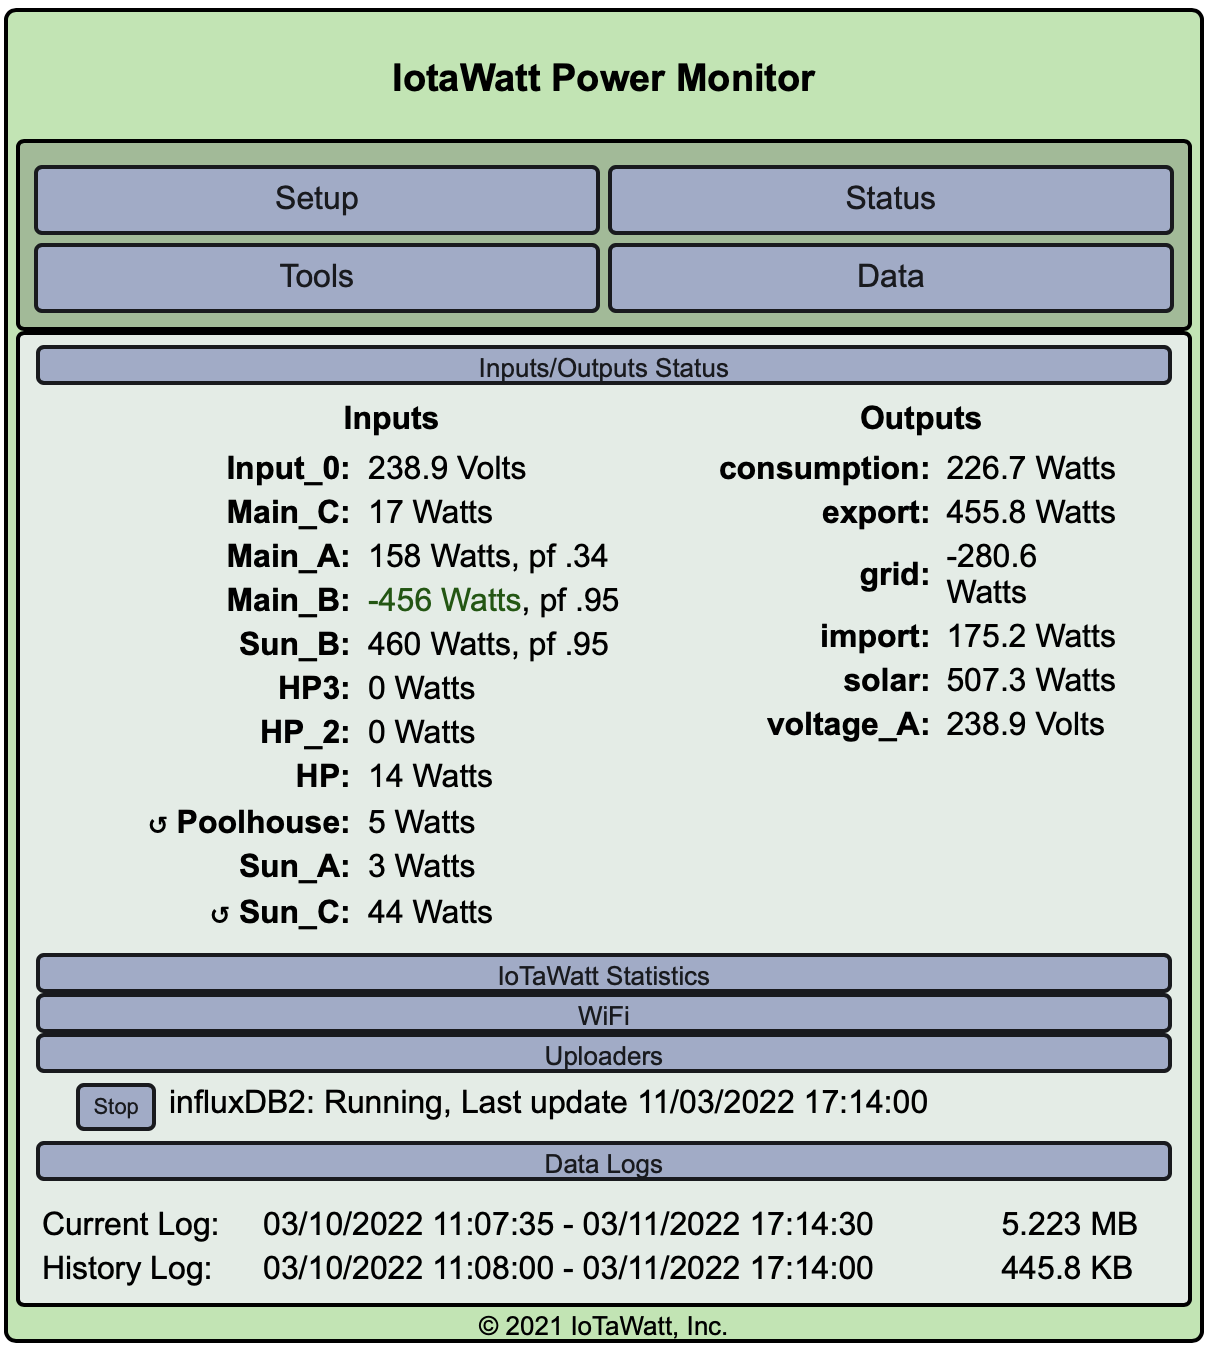
When solar is distributed over the 3 phases, it seems that in the morning and the evenings some phases are cut of providing back to the grid…
In this example. 1 phase is still delivering to the grid (main_B) , and two are not (Main_A and Main_C). Am i actually importing electricity on those phases? Trying to understand what is behind, as in Belgium they will soon charge differently and i am trying to improve the consumption of my own production. Thanks for any insight.
Bonus question: Enable derived three-phase, (which i did), what is the general error margin for such a system given 3 phases in combination with solar…
Thanks, i think it is… During the day the 3 phases give back equaly to the net (1K watt +)… it is only late in the afternoon the convertor starts scale down (first to 2 phases and then to 1 phase as in this example).
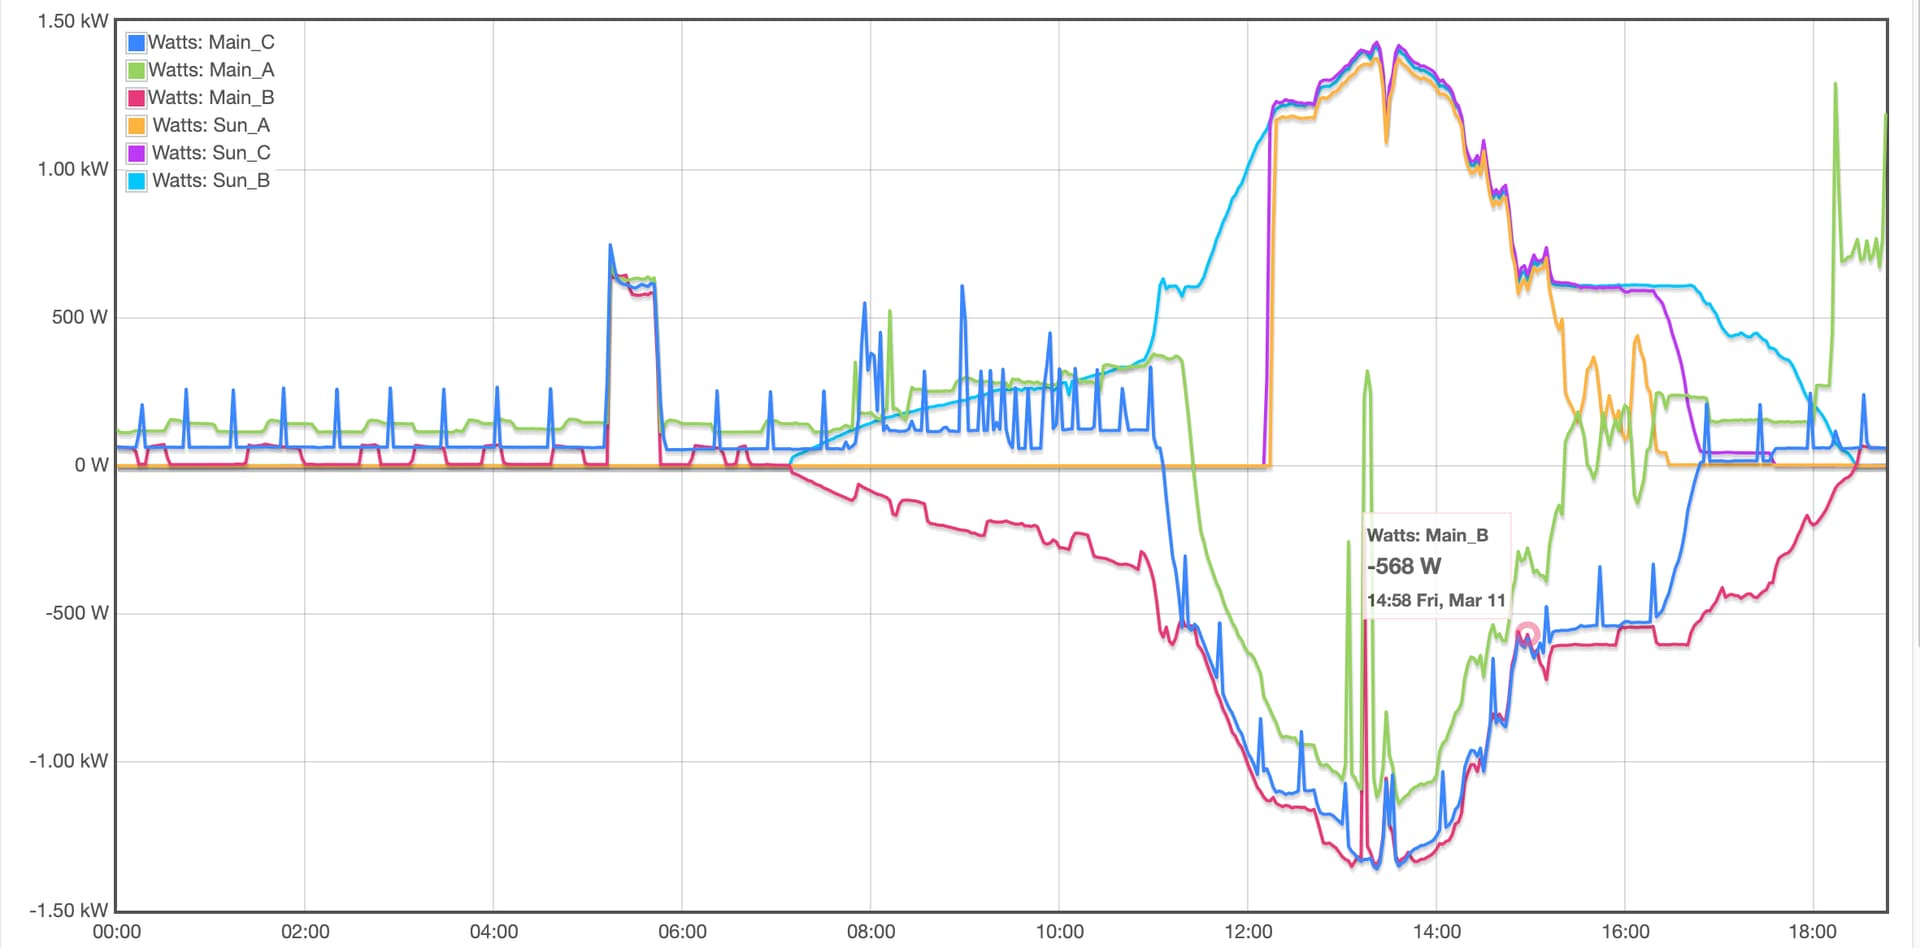
Can you plot the three inverter outputs and the three mains together over the last 24 hours using Graph+ and post it?
Edit by together I mean all six traces on one graph.
It does appear that phase B is working normally. There is something wrong with Sun_A and Sun_C in the late morning as the corresponding mains are being driven negative (exporting) but the inverter output shows zero until just after noon. Perhaps the CTs were not installed? They do seam to work well after that with corresponding response in the mains, but as you say, later in the day as the total power drops, first phase A drops, then phase C, and finally phase B. It looks as if the inverter tries to maintain about 700W output and shuts down phases to maintain that on the remaining.
It would be interesting to see the voltages on each of the phases as that may be the controlling factor. Just measuring B and C with a multimeter while this is happening might be useful. You also have the ability to add one or two more VTs to actively monitor it and go to Direct Reference.
Yes, that appears to work, but I would caution you that it will become less accurate if you zoom out to a weekly or monthly view. You might want to use an integrator to accumulate import and export energy. It’s a pretty straightforward case where you would create an integration: