Hi,
I have 3 voltage inputs for 3 phase, but the while first one is showing live data fine on the status screen it is showing 0 in the graphs, so presumably isn’t logging/recording into the database properly. It also uploads that voltage to Pvoutput which is also showing 0.
Historical data for it is fine, and the other 2 voltages are working fine too in the graphs.
Possibly a corruption in the database?
Do you have any suggestions on how to fix it without wiping it and losing all historical data?
I was on 02_06_02 but changed it to alpha and now have 03_06_03 but it hasn’t helped
Thanks
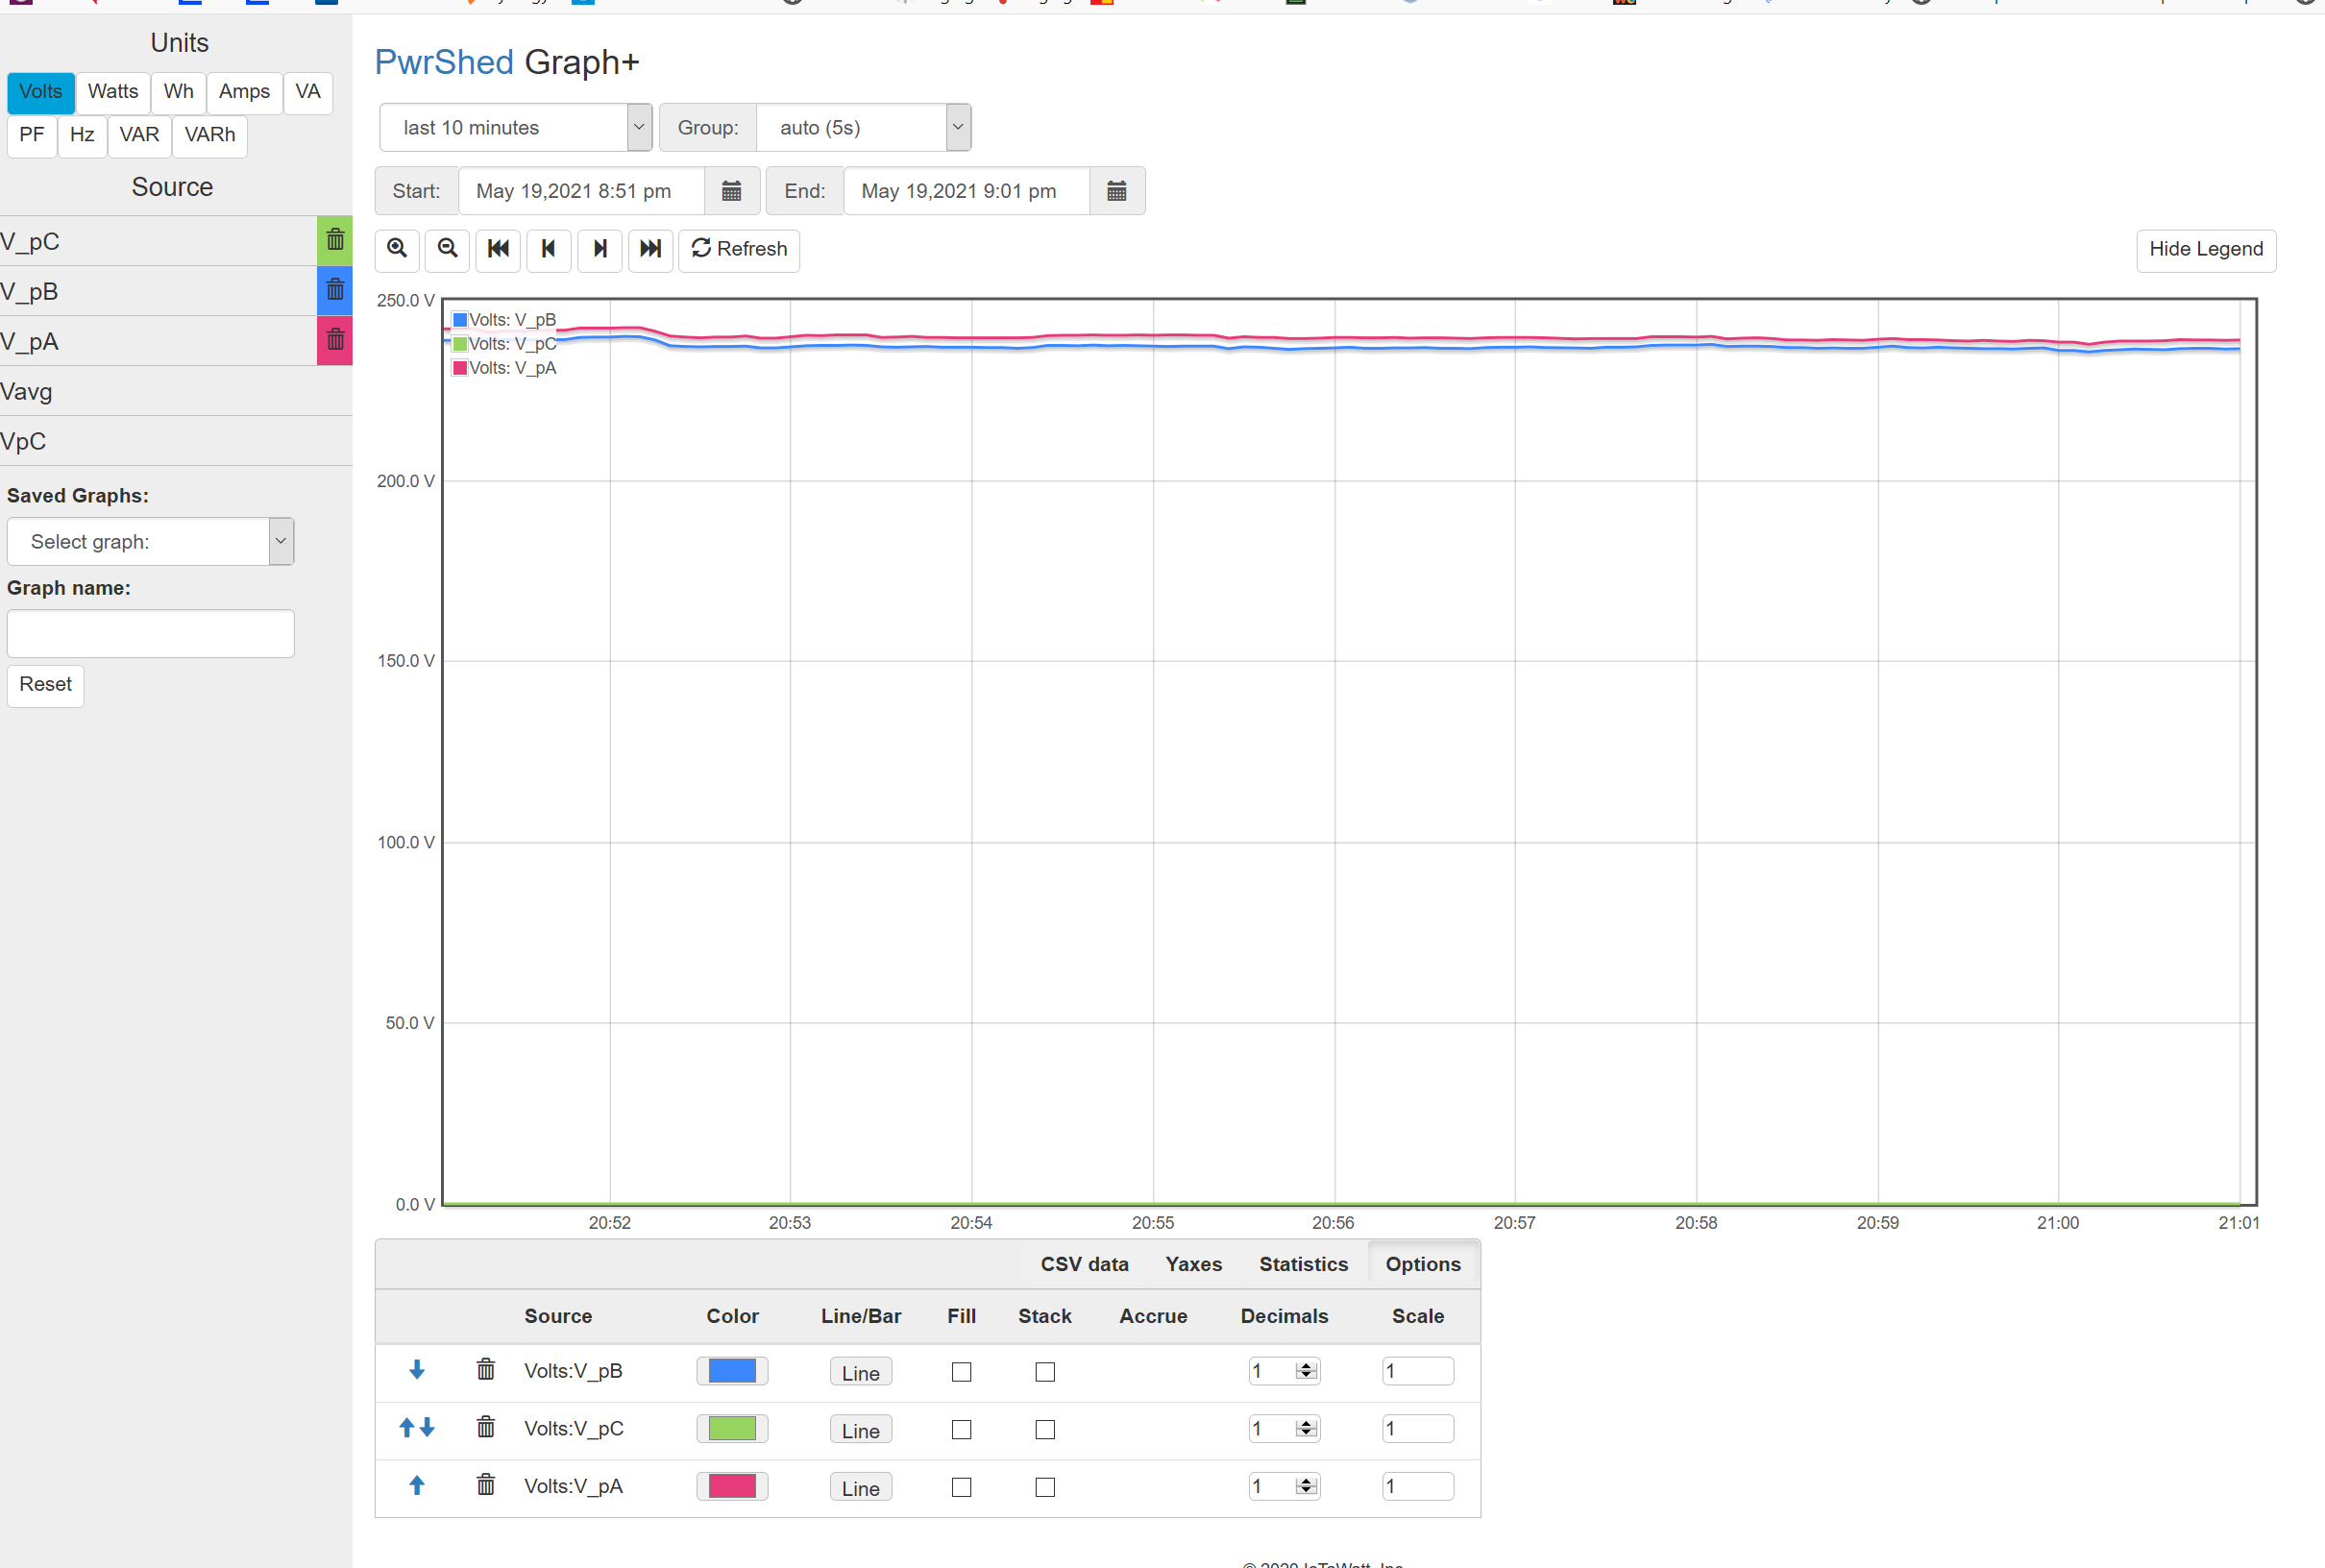
Can you show the inputs setup display, and a graph that shows the three voltages where the one goes to zero?
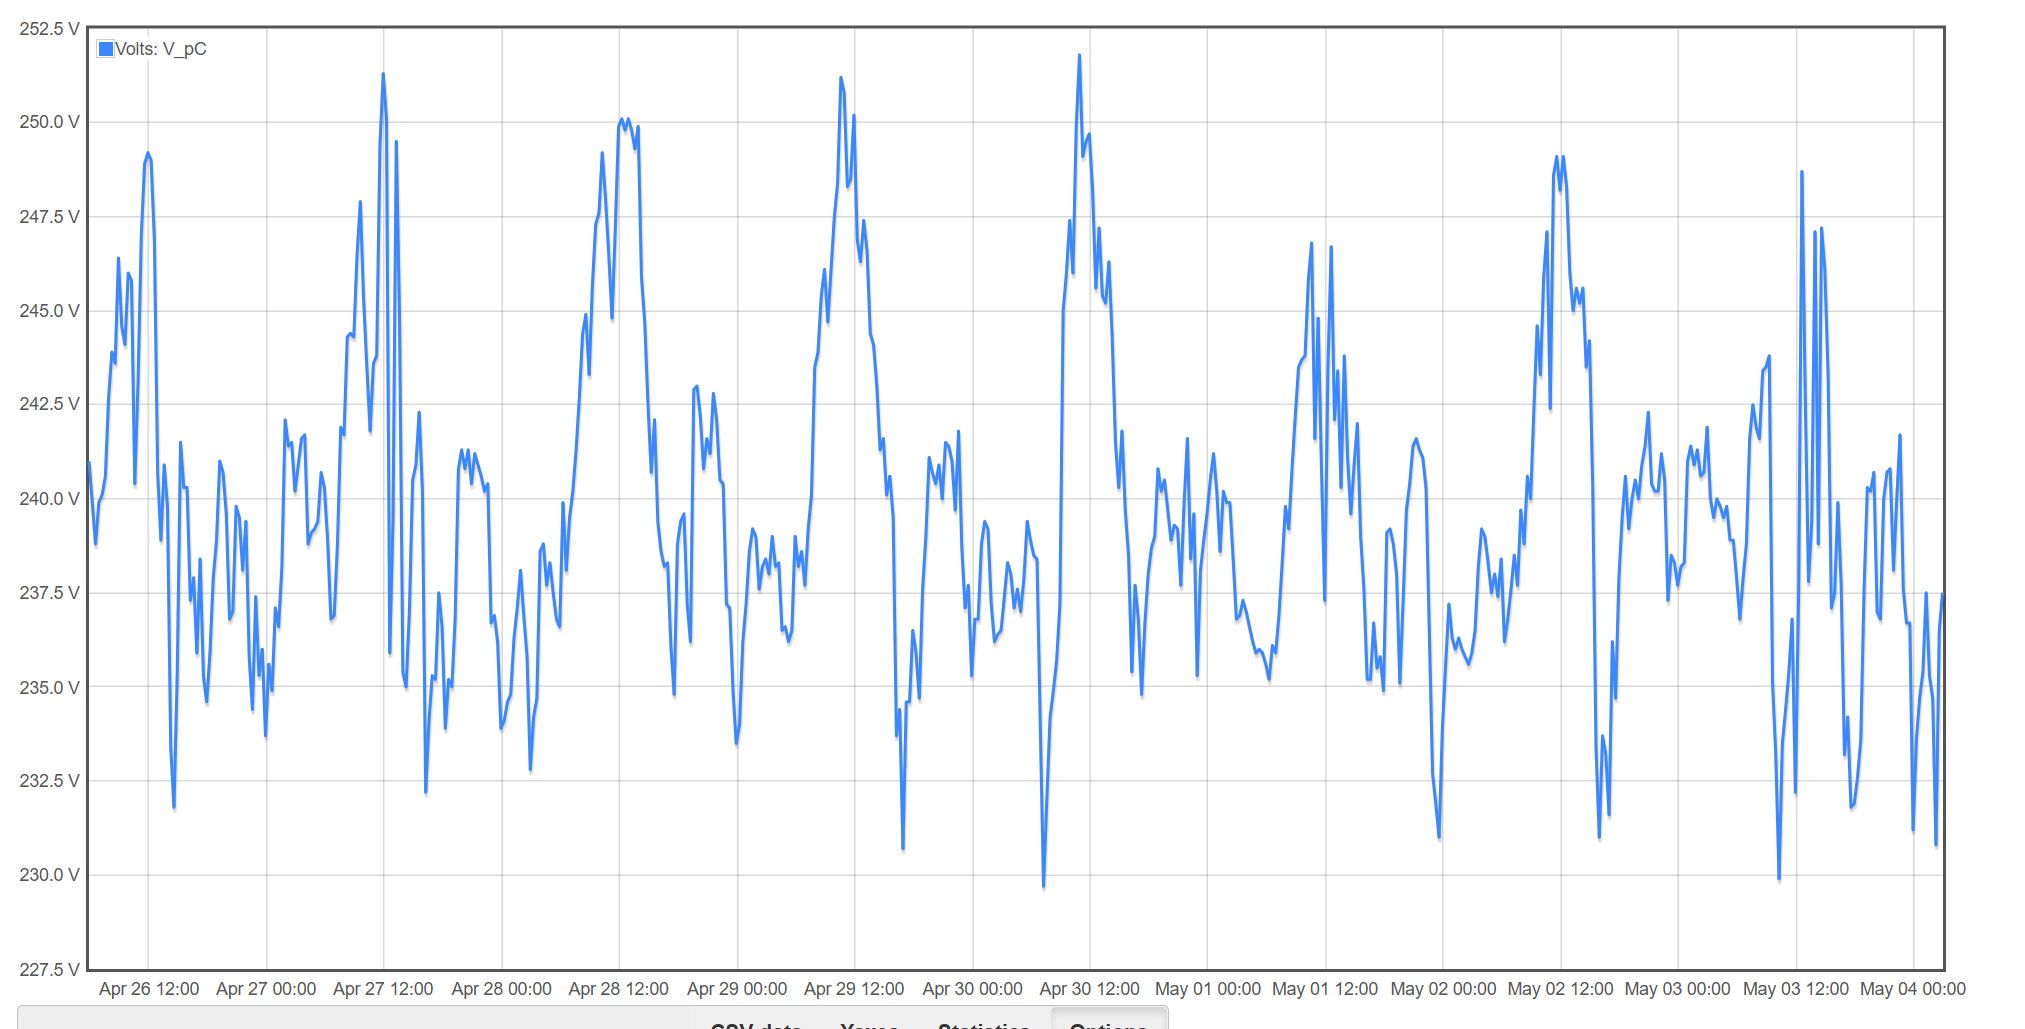
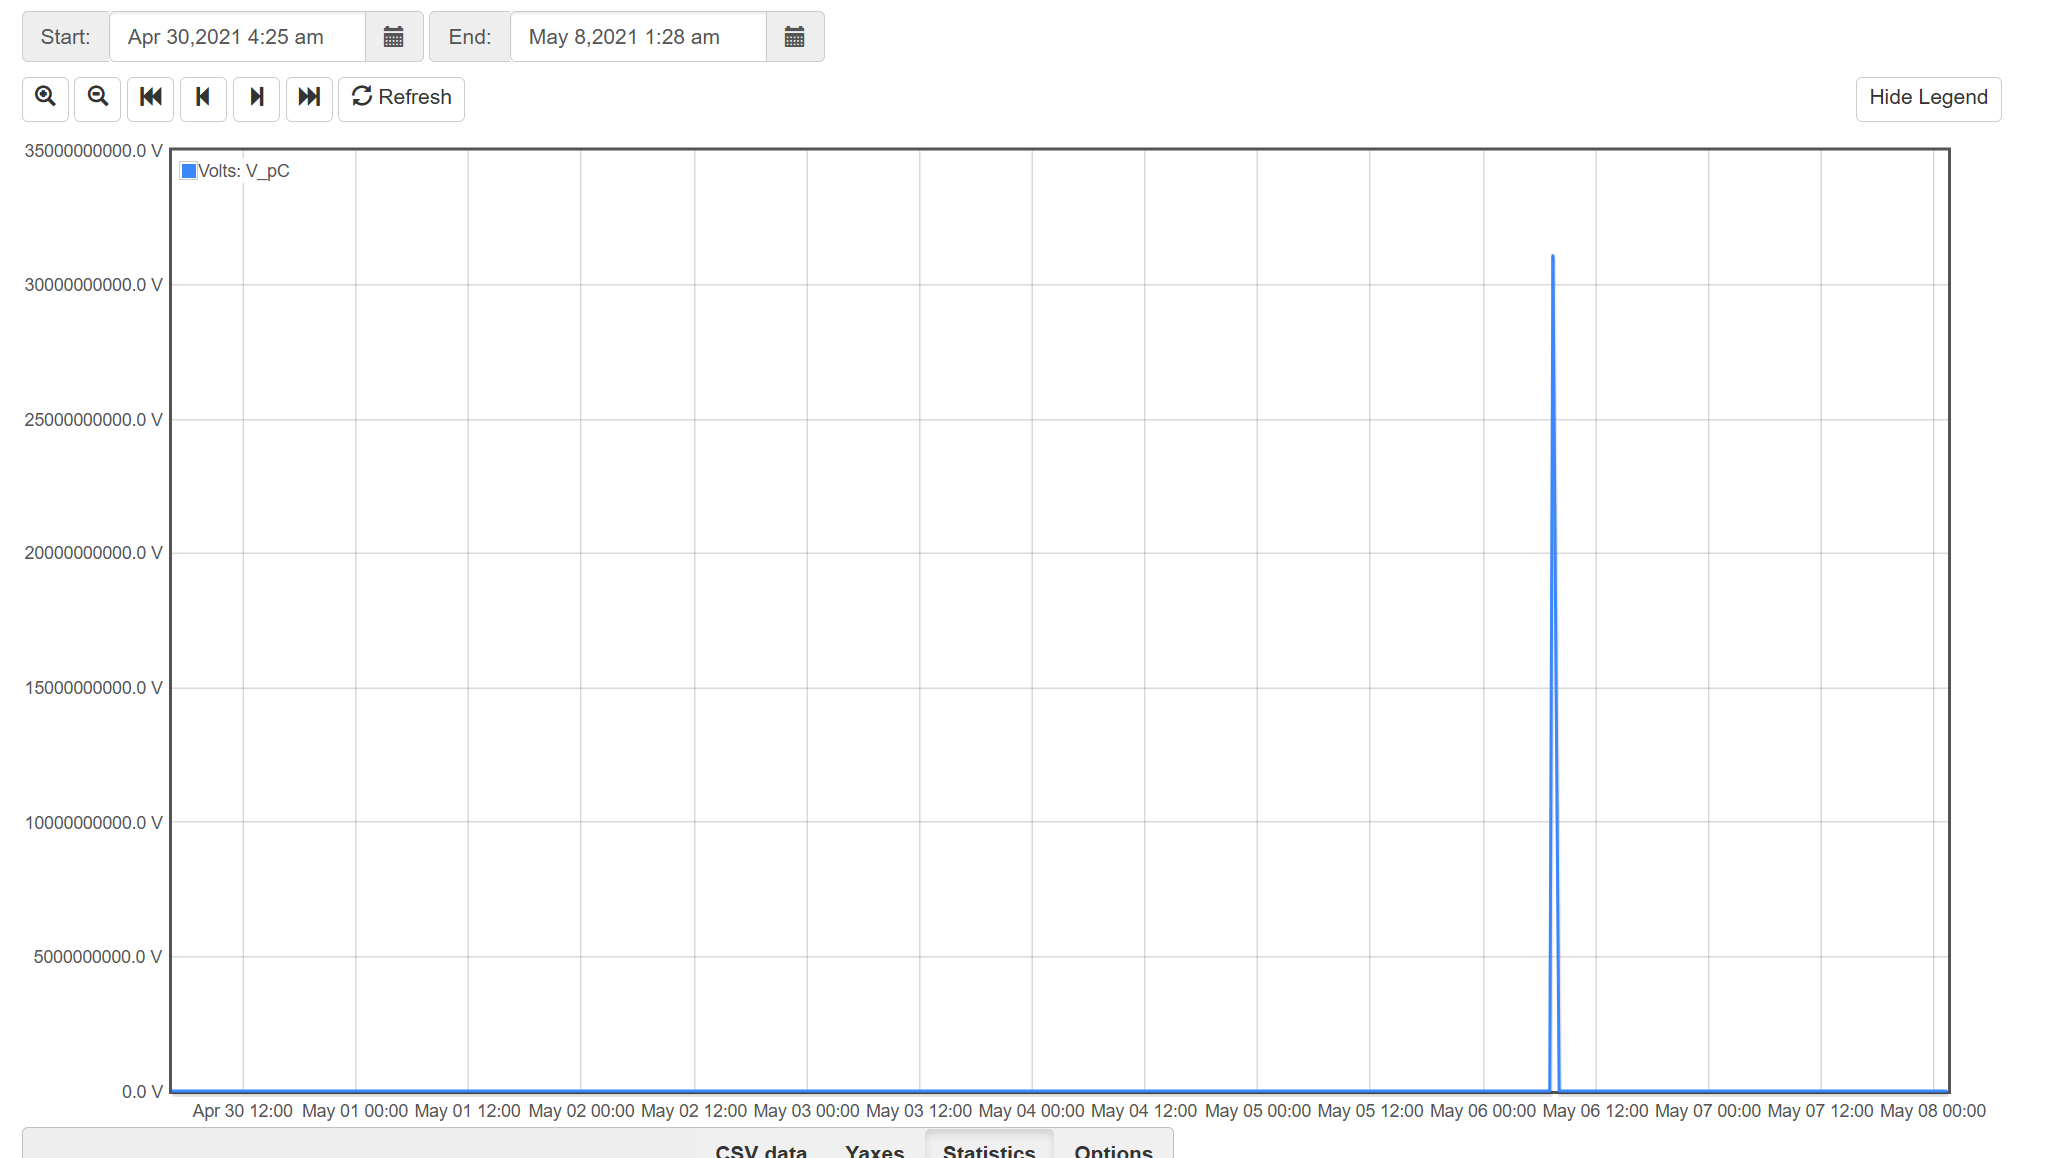
I just showed the last week, then went back week by week to find when it stopped, but it threw errors. I tried and again and it is pretty odd, 26/4-4/5 is ok, but if I move half a frame across suddenly it is all 0’s even though it is then 30/4-8/5 and should have at least some data. Though there is a huge spike on 6/5…is that causing a problem?
Not good. There does appear to be damage to the datalogs. I don’t think there is any way to fix it, but there are still some unanswered questions that I have to understand more specifically what the damage is and why it’s localized to the one voltage channel.
First to answer your initial question about losing history. Further investigation may reveal more extensive damage, but right now it appears to be localized to this one channel. I do think that wiping the datalogs would fix it, but all you are missing is the history for this one voltage channel. It appears to be working properly as far as a reference for the related power channels.
To better understand what happened, could you do a few things:
With Graph+, you can zoom in on a section of the plot by selecting the horizontal area you want to zoom with the mouse cursor. Could you try doing that for the bottom plot above stopping short of the spike to see what you get?
Could you take a look at your /iotawatt/iotamsgs.txt file and post the portion of the message log that includes May 6?
Can you try to plot V_pC using the “original graph”? It doesn’t use query so might produce different results.
Graph+ seems to not want to zoom any more as I get close to that spike, just stays selected and doesn’t update the graph. I can see right up until that spike it is the right 240v or so values, then the spike looks like one value, then 0V after that.
The original graph shows 0’s for the current data, including in the CSV output (does the CSV output in the Graph+ not work? Shows weird values for any sensor). As I scroll back it works until I get to the 6th and it then locks up, and the same if I select the last 30 days or any longer, it doesn’t display at all but is fine for other sensors.
I can’t download /iotawatt/iotamsgs.txt -it starts and does 12mb then fails, if I read the partly downloaded files it only goes it 8/10/20
Corrupted SD card maybe? Anything I can try to repair it?
Well thanks for trying. Would make more sense to just replace the SD card at this point. If you get a 8gb card, copy the contents of root from this card, and restart, it will create new datalogs and iotamsgs.
There is no way to repair the damaged data logs.