First post. I have two IoTaWatt systems, one for each house. They work great for monitoring things in real-time (Status) and for viewing when what loads were on when using the graphs, i.e. did my irrigation system actually run last night, A/C duty cycle and so on.
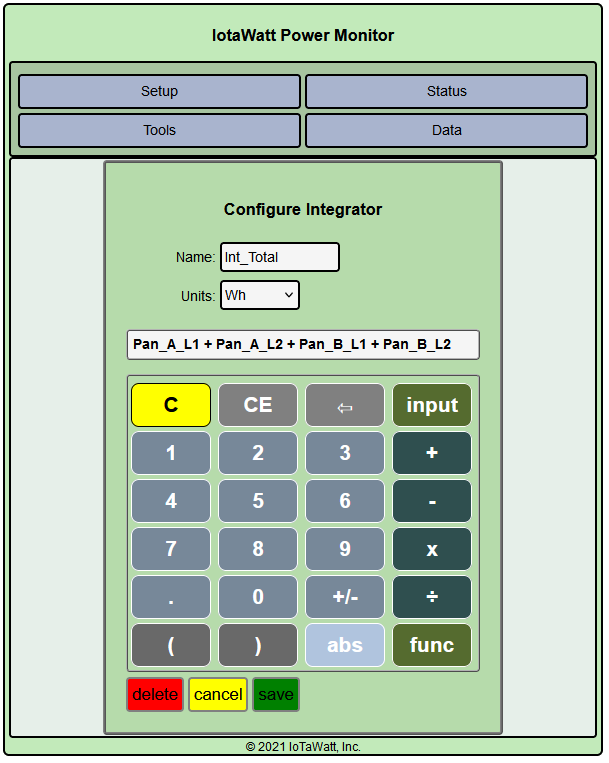
Now I’d like to see how many watt-hours things are using. So I’m trying Integrators for the first time. This house has two main panels, and I have a CT on each feed leg. So I set up an integrator that sums them, with units in Wh:
Integrators are useful to keep track of the ups and downs of a circuit that can have bi-directional energy flow. In most cases, that means keeping track of the energy imported from or exported to the grid when you have a renewable energy source like solar or wind. If you don’t have such a renewable source, you should have no need for them and shouldn’t be using them because they introduce unneeded complexity and overhead.
But to answer your question, the reason there is no Wh output available in the status display is that units like Volts, Amps and Watts have no time context. They just tell it like it is - right now.
Watt-Hours on the other hand require a context to be meaningful. It is a unit of energy. You need to know the period being measured. Your electric meter has a single [kilo]Watt-Hour meter, but the reading, by itself, is meaningless. The utility typically reads it monthly and then sends you a bill that has the current reading and the reading at last months billing. Your charge is based on the difference between the two, so there is a context of one-month.
When you run graph+ on the IoTaWatt, you select a time period. If you then select an input or output using either the Watts or Wh units, you will get a plot of the individual intervals (groups) and if you select the “statistics” tab at the bottom, the total Wh for the period will be on the right. It has a context in that there is a selected period over which the Wh are added up.
Alternatively you can use the query API to request Wh for any input or output, but here again there is a begin and end date/time to provide context.
If you leave a 100 Watt light bulb on for an hour, you will use 100 Watt-Hours. Leave it on for 15 minutes and you will use 25 Watt-Hours. What it uses in Wh can’t be defined without knowing for how long it is measured, but it will use a steady 100 Watts over whatever period you measure.
So use Graph+ to see your Wh consumption over any time period.
I was indeed thinking an integrator output in watt-hours would run cumulatively, just like the utility company’s meter, and I’d have to take readings from it regularly to give the values time context.
I did totally miss the fact the Sum/Integral kWh were available in Graph+. That’s actually perfect for what I want, especially with options like Yesterday and Last Month.
I do have solar at my house up north, and will be getting it here shortly. Contract is signed, utility company has approved, now we’re just waiting for the building permit from the County.