I was trying to reconcile some of my data in Influxdb and ran across something that looked a bit odd, and raises the question about what is flowing into Influxdb also.
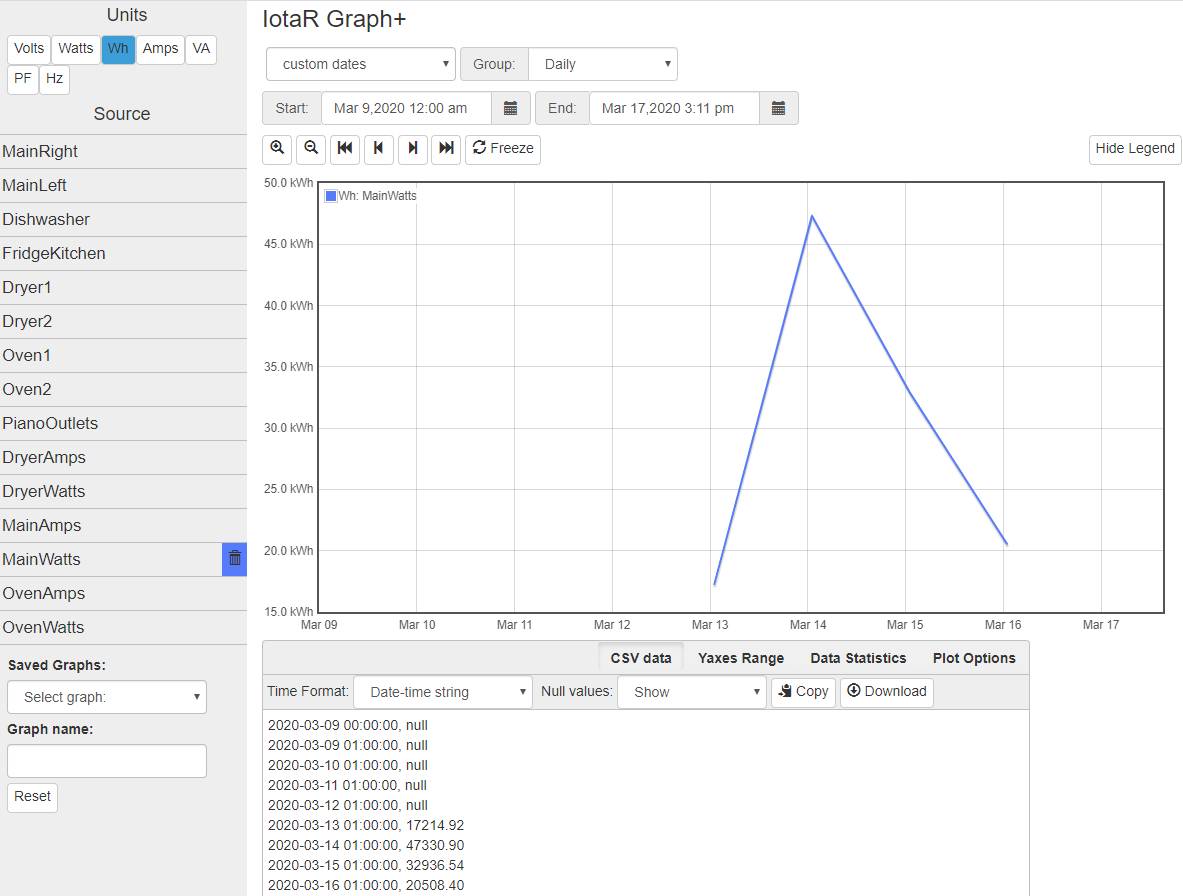
The aggregation is daily, but each point occurs at 1am. Is that 1am data point intended to be the time in the period 00:00 thru 23:59.99? Or is it 01:00 thru 00:59.99? Or something else?
So I changed the group to Hourly, and looked at those periods, and summed them in groups of 24, and one answer is that it covers the data reported as being 3/14/20 01:00 thru 3/14/20 00:00 (the total is a match only for that range). Though this actually just changes the question to what those represent, is the label the beginning or end of the period.
I THINK the hourly period represents the beginning of the period, as at this moment in time I’m at 15:34 and a group by hourly shows data in the 15:00 period. Note that my time zone appears right, at least the log time on the status page matches my clock.
So I think… maybe… the Graph+ plot for daily is skewed an hour?
Though… it seems odd that the time shown on the status screen at the bottom on the logs was right, not off an hour. But checking the box fixed that graph.
But I’m off an hour on the Influxdb. Let me wipe everything out and re-export and see what happens. I’m assuming the data itself is UTC so that should get everything back in sync, right?
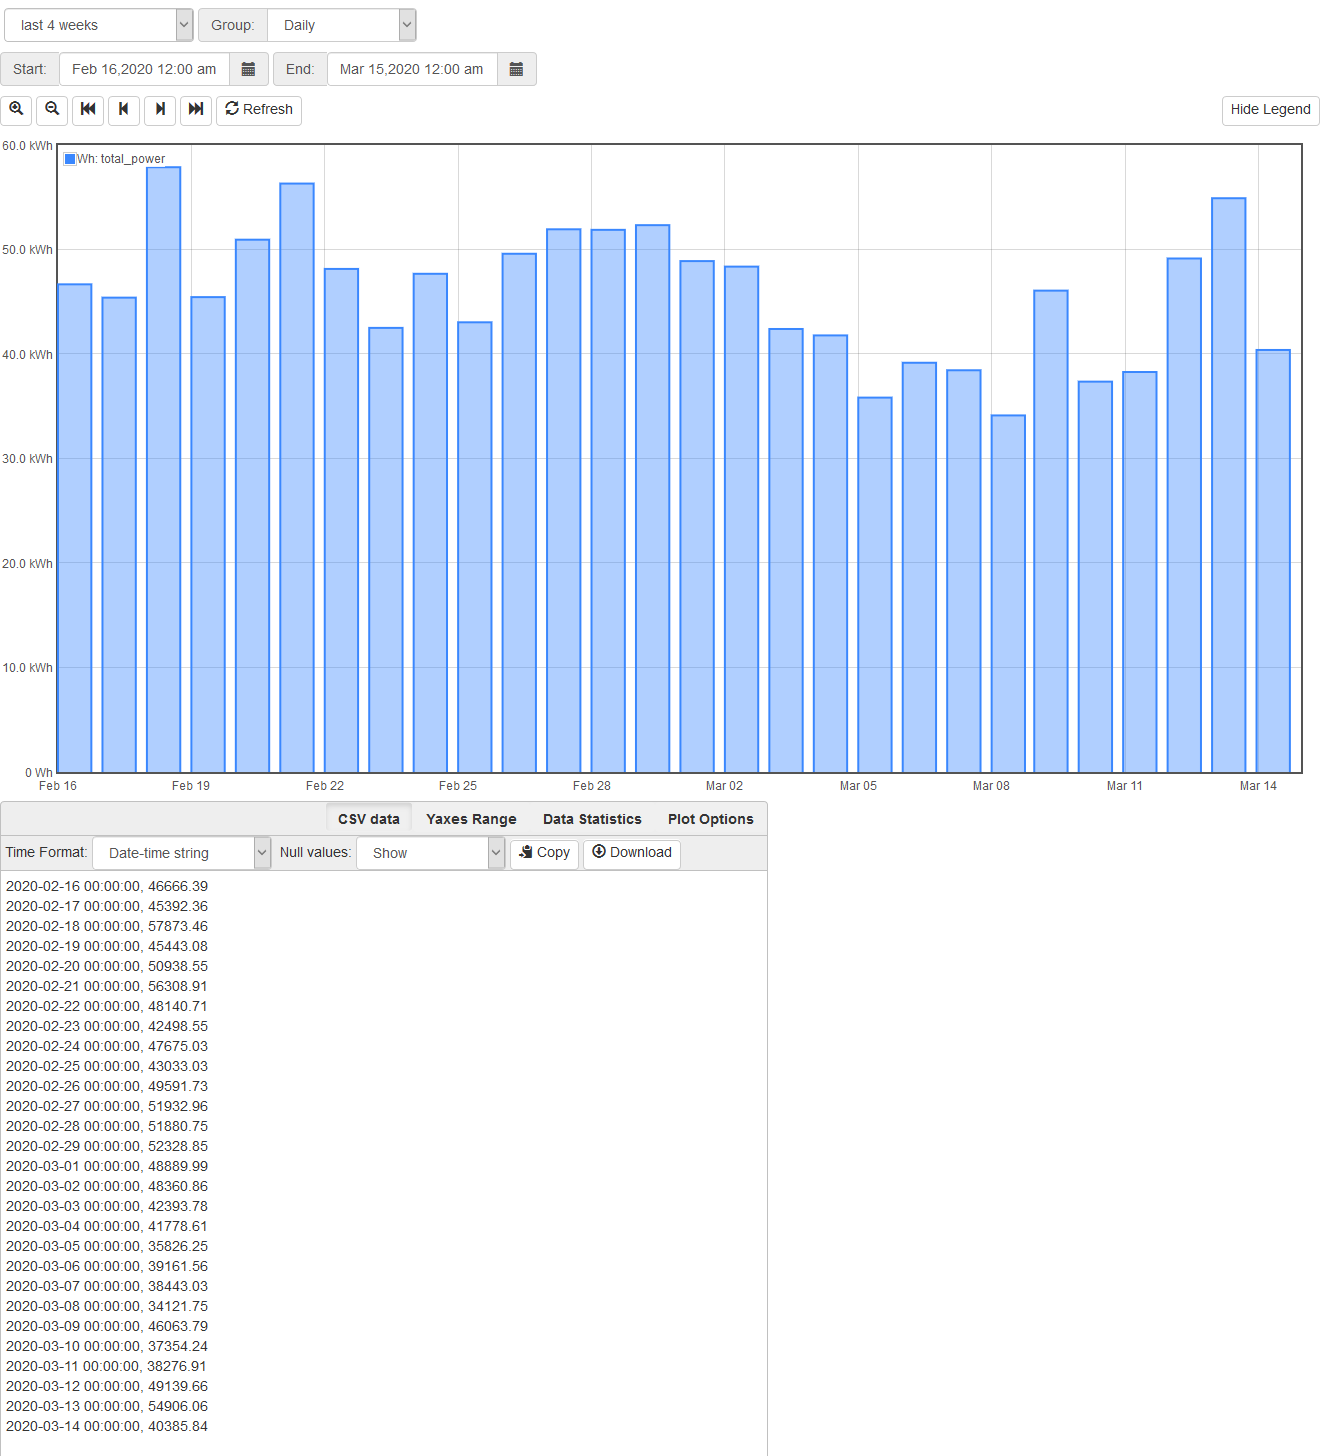
Now it matches better, but I think Iotawatt is not including periods when it was not running (to be expected; I was pulling CT wires for maybe 30-60 minutes yesterday) but Influxdb’s integral is probably interpolating during that interval. The Influxdb hit 34.35 kWh yesterday, the power company 34.23. That’s 0.35%. Could be luck of course (stopped clock and all that) but definitely encouraging.
All times outside of the message log, query and PVoutput service are UTC. The log times are reported to status in UTC and is converted by your browser to local time.
That should not have been necessary. Influx data is time stamped with UTC.
That should not have been necessary. Influx data is time stamped with UTC.
It was easier to just redo than to find out. I decided I wanted to change measurement name anyway.
What does Graph+ say?
33.646 kWh. The one monitoring the mains is the one I needed to dress the wires, so I disconnected it entirely long enough to pull everything, tie up, etc. The difference is in the right direction for missing data and seems a reasonable amount for the hour or less it took (I can’t recall exactly when I powered back up vs wire-tying cables).
Today is almost 100%, so a few more days I’ll see. Now I’m trying to bring over other interesting stuff from Home Assistant like A/C run time during the day, outside temperature peak (maybe I can figure out how to calculate degree days).
What got all this started I also need to try – I swapped a regular hot water for heat pump hot water. I need to run a couple of similar days with electric vs heat pump heating and see how they compare.
I won’t keep doing this daily but just an FYI, yesterday it was connected a full day (I did do a couple restarts trying to fix a problem that had nothing to do with it so a couple minutes might be missing).
The largest difference is .32%, so really, really close.
This is a matter of some concern, and I really must complain – I was expecting installing this to keep me occupied for a long time while I “shelter in place”. Instead it went quickly and easily and I’m back to trying to find something to do. Is that grounds for a refund?