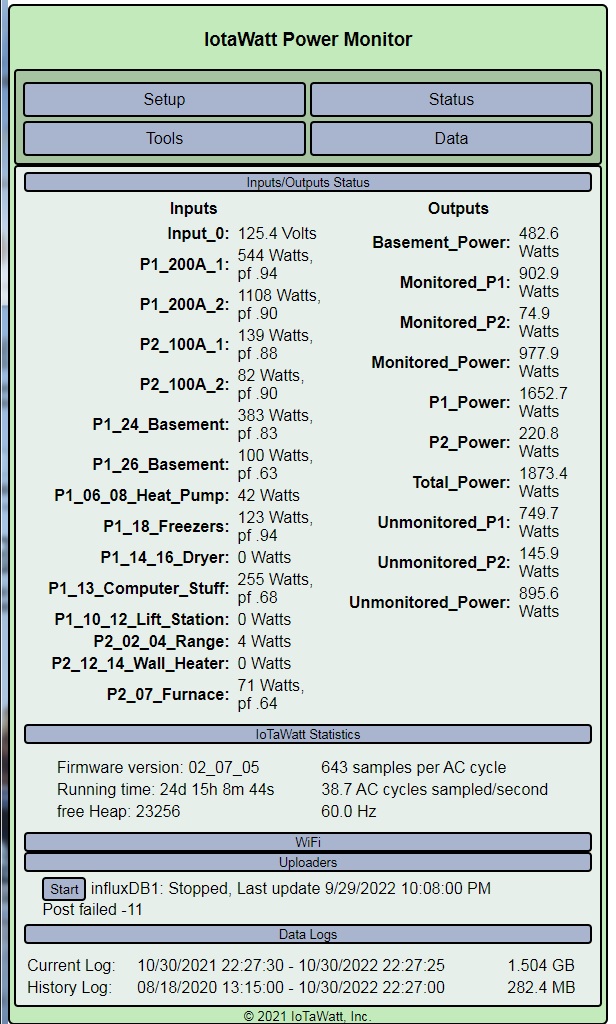
Having a weird problem with IotaWatt updating Influxdb. I had some issues with the data in Influxdb so I ended up having to delete the last 30 days of data in my Influx database. I stopped the uploader in IotaWatt, went to my Raspberry Pi and deleted the records. I restarted the uploader and it took off from the date/time the records were deleted. I got a “Post failed -11” message but the updater kept on going a little farther. It stopped again on 9/30/2022 and just sat there. It has not moved since then. I tried stopping and starting the uploader as well as restarting the Raspberry Pi not no avail. I’ve uploaded some screen shots and the log. Any ideas as to what’s happening?
Dave
 Log.txt
 (9.8 KB)
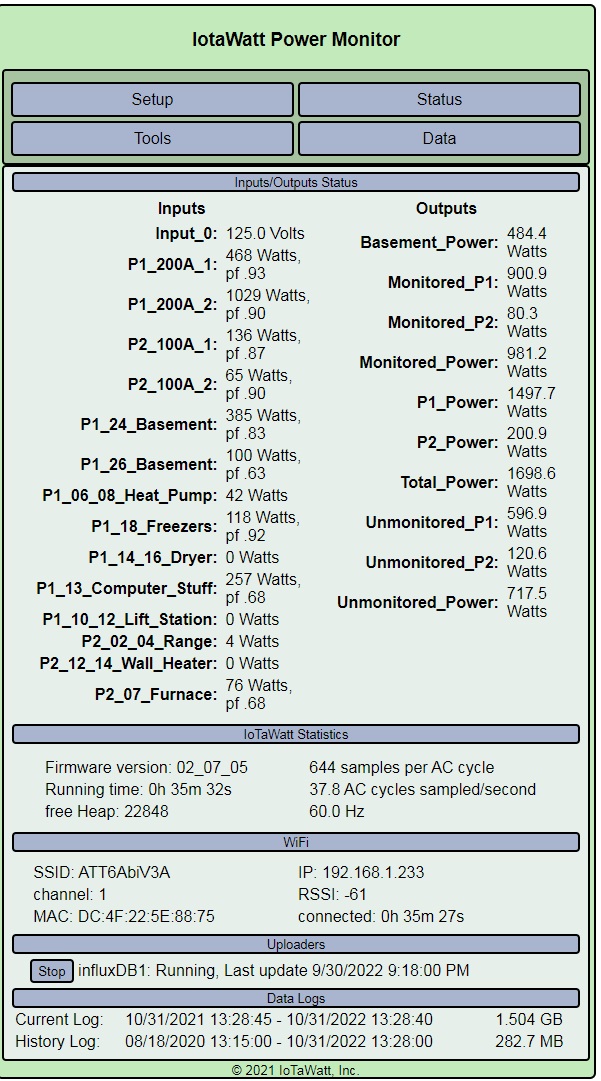
Try restarting the IoTaWatt using the restart in the tools menu. If problem persist, please post the status display and the message log.
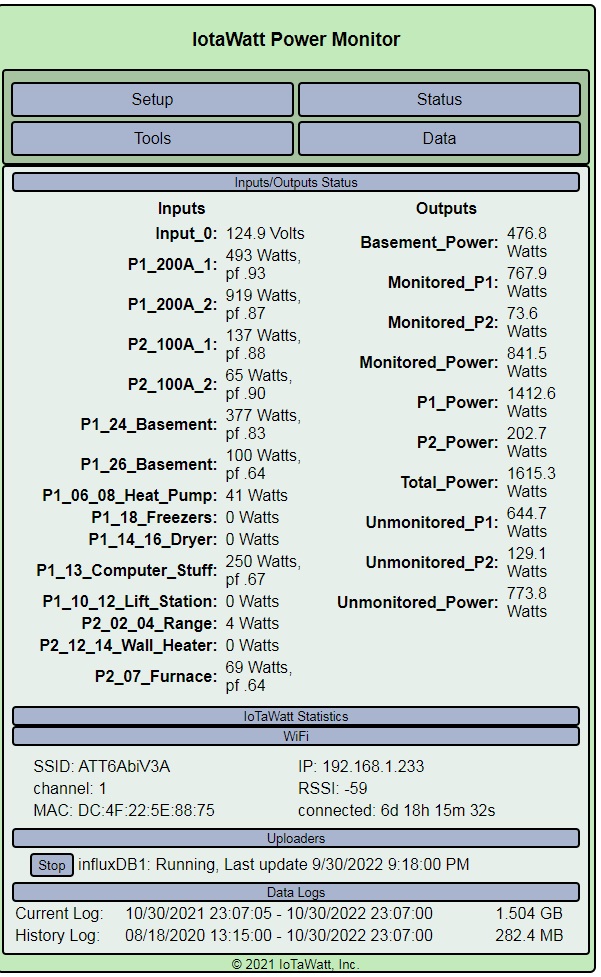
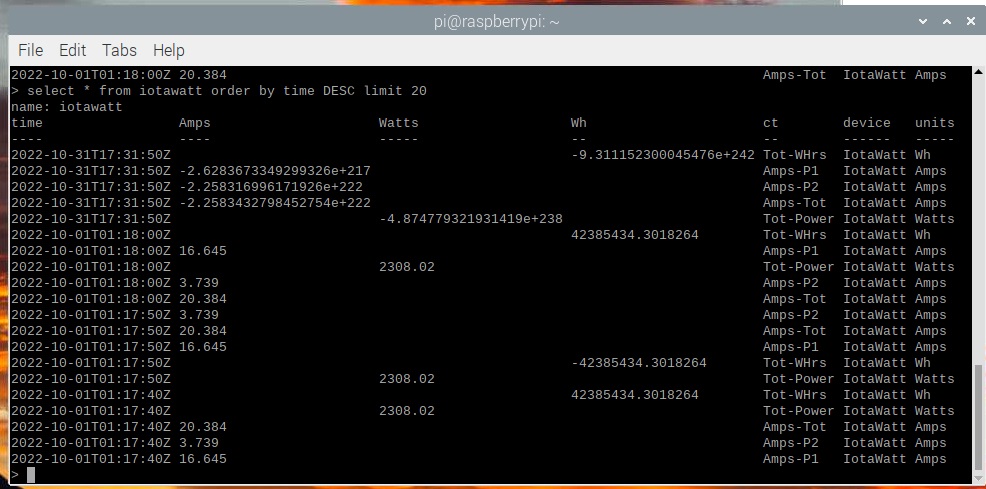
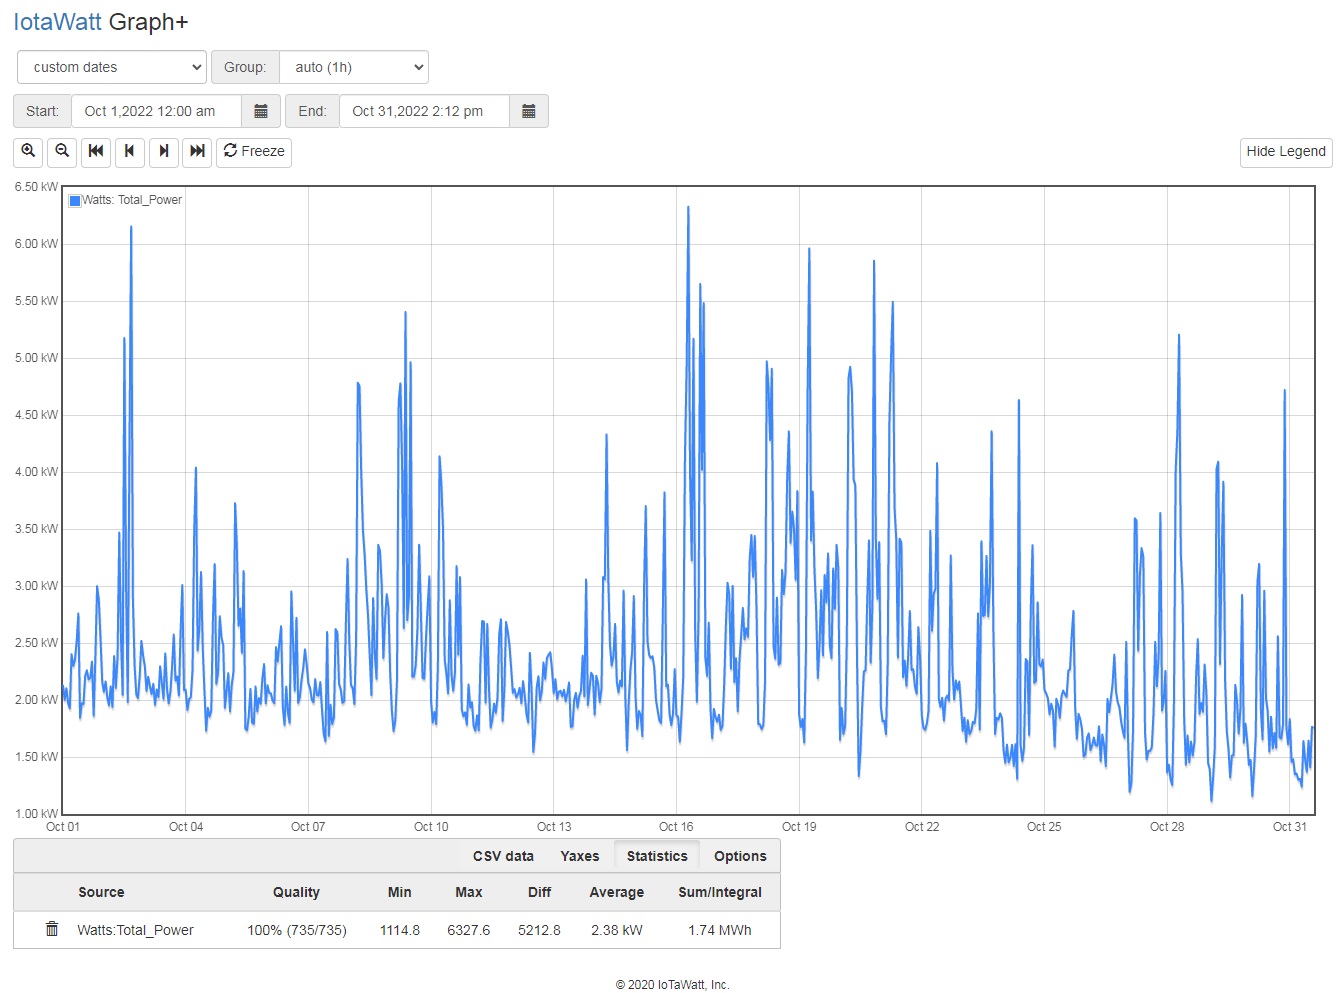
Now i’m really confused. When I looked at the status this morning, it still showed the last update as 9/30/2022. I went ahead and restarted IoTaWatt as you can see in the attached log. When I looked at the status, it showed the last update was 10/31/2022, so I went to check the data in grafana. Grafana showed nothing after 9/30/2022. So, I stopped the uploader, deleted deleted all the data after 9/30/2022 in influxdb and restarted the uploader. It took off as normal. I did notice several “Post failed -11” messages as the uploader was running but it continued right up until it got to 9/30/2022, same place as before. I let it sit, watching it for several minutes, then checked the data in grafana. There was still nothing past 9/30/2022. After about half an hour, I stopped the uploader and checked the log. Both the status screen and the log shows the last post of 10/31/22 which means it would have uploaded over a month’s worth of data in about 30 min - the data usually doesn’t move that fast. At any rate, grafana still doesn’t show anything past 9/30/2022. I also took a screen shot showing the last 20 records in the InfluxDB database (in descending order). The top 5 records look pretty funky. However, you can see there is a BIG gap after them. It goes from 10/1/2022 to 10/31/2022. I also added a screen shot of the total power for the month of Oct straight from the IoTaWatt graph tools so you can see there is data in IoTaWatt. For some reason, it just doesn’t seem to want to upload to InfluxDB.
Log.txt (9.8 KB)
There may be some datalog damage or SD issue on retrieval. First, I would try to skip over the 9/30/22 data:
- Stop the uploader.
- Drop the influx data after 9/30/22.
- Set “upload history from” to 10/1/22.
- Start the uploader.
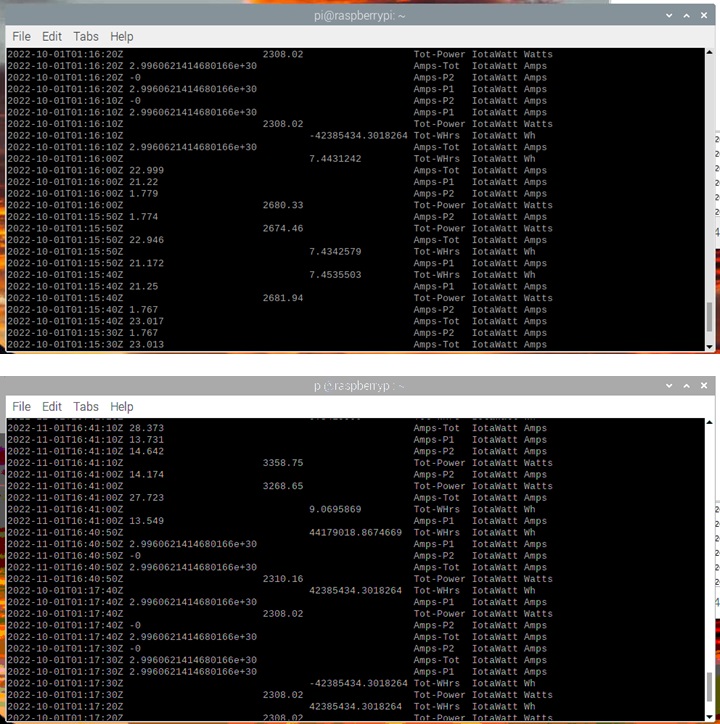
Well, some more interesting results. I had left the uploader stopped overnight. This morning, I changed the upload history date to 10/1, deleted the influxdb data past 9/30 then restarted the uploader. It just sat there. I let it sit for about 5 min, then stopped it again and changed the history date to 10/2 and restarted it. Again it just sat there, apparently not updating. I tried several more (probably 5 or 6) dates in October with the same results. Finally, I put 11/1 in the history date and restarted the uploader and it took off just like normal. I checked the influx database and it was filled with dates from 11/1. I stopped the uploader again, deleted the influx data after 9/30 and started backing off the history dates to see if there was a specific date in Oct causing the problem. Got back to 10/1 and it took off. I let it run for several minutes and all seemed to be working fine again. So, I decided to change the history date back to 9/1 and restart the process just to see if it would stop again at 9/30. It finally stopped at 9/30 again, but this time after several minutes, it went straight to 11/1. I’ve included a couple of screen shots showing the InfluxDB data. The first one shows the point at which the data starts getting wonky. The second shows the skip from 10/1 (Zulu) to 11/1. Finally, after all that, I deleted all of the data from the wonky data point on, set the history date to 10/1 and restarted the uploader. It’s almost up to 4 Oct now and seems to be running full steam ahead. It’ll be a few more hours before the upload completes, but I’m hopeful!
Still getting a several “Post failed -11” errors. What do those mean?
Just checked the uploader and grafana. It appears the data uploaded successfully and is displaying in grafana as it should. Still wondering what the problem was and what the “Post failed -11” errors are. Thanks for the help!
Dave
-11 is a timeout. No response from server.