@overeasy, this is not a rush or requirement as I know it is a bit outside the norm, but I thought I would bounce it off you for ideas. Do not rack your brain too much on it as I know you are dealing with many other install types, etc.
Just some raw data if it helps in any way. I ran a RAW chart as you suggested of “MAINS1 + MAINS2 + BATTERY1 + BATTERY2 + SOLAR1 + SOLAR2” which should be my home consumption; works for the IoTaWatt reporting and my EmonCMS dashboard but as you saw with the PVOutput chart sent yesterday it seems to really skew the kWh used (consumption) and feels I consumed 270+ kWhs.
When I pull the two BATTERY feeds from the PVOutput consumption equation, I get back to a rather normal chart. But, as you said, PVOutput sees my battery charge as being consumption when it really is simply doing storage and not being consumed; no energy being consumed at that time by the home.
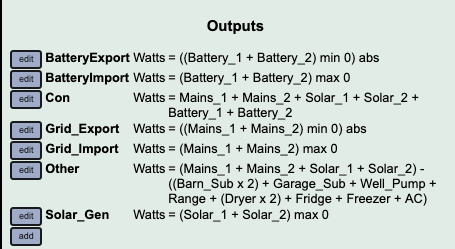
I configured and treat the battery as a load like the grid. Like the home has two potential grid feeds. A negative number means I’m charging (Exporting) the battery and a positive is discharging (Importing). Using the formula in the IoTaWatt, I can see that home consumption it correctly reported. Here are how my IoTaWatt is configured (mirroring the grid) for battery usage.
And the status looks like:
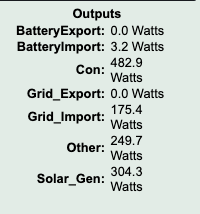
Where Con is home consumption.
When I do a RAW graph in the IoTaWatt I see this for the last 24 hour period.
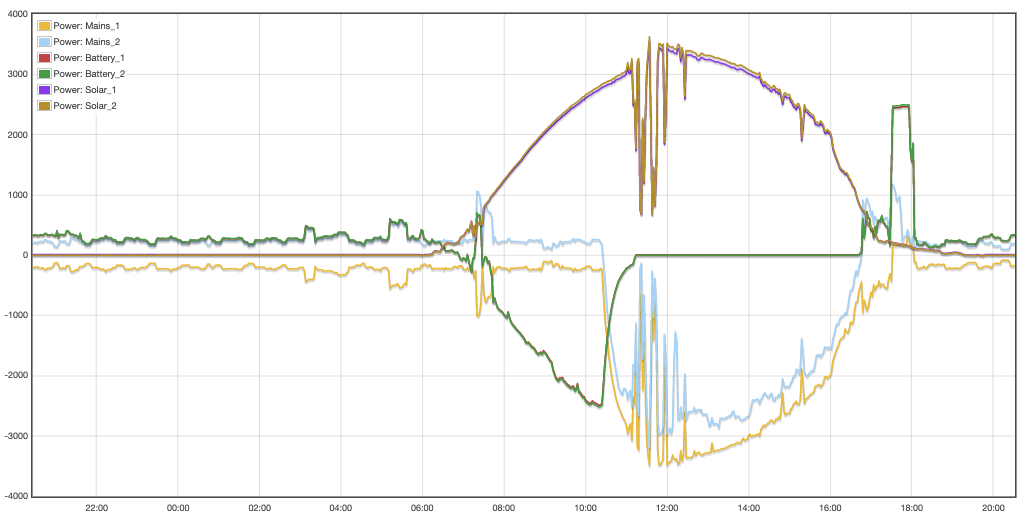
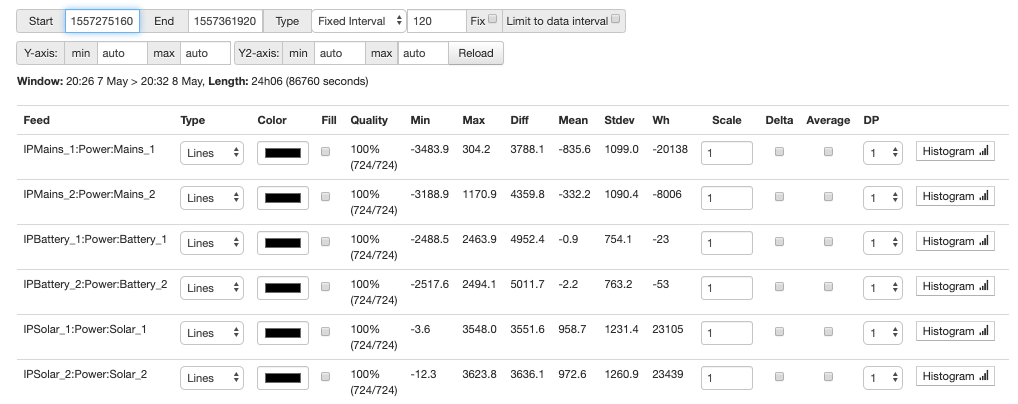
With the RAW CSV attached here:
RAWGraph.txt (45.2 KB)
Again, I understand this is a bit abnormal, but all appears correct with the IoTaWatt and EmonCMS reporting when I simply add the two Battery feeds to calculate consumption. It is only the PVOutput that the change seems to impact. That is the odd part.