Recommended Influxdb2 & Grafana setup?

Hey all!

I just installed IotaWatt last night and have been playing with the data/Grafana dashboards. Loving it so far! But I’m curious about how everyone have setup their influxdb tags and measurements for the uploader?

I left the measurement and field-key values as defaults ($name and ‘value’), and added tags: iotawatt.id=1, name=$name, units=$units.

For measurements I just put all the raw inputs, no calculated outputs/integrators (I’m not really sure how those work yet). Is uploading the KWh’s recommended vs calculating during query?

I’m also interested in how everyone has setup their Grafana dashboards, any panels/insights you find most useful?

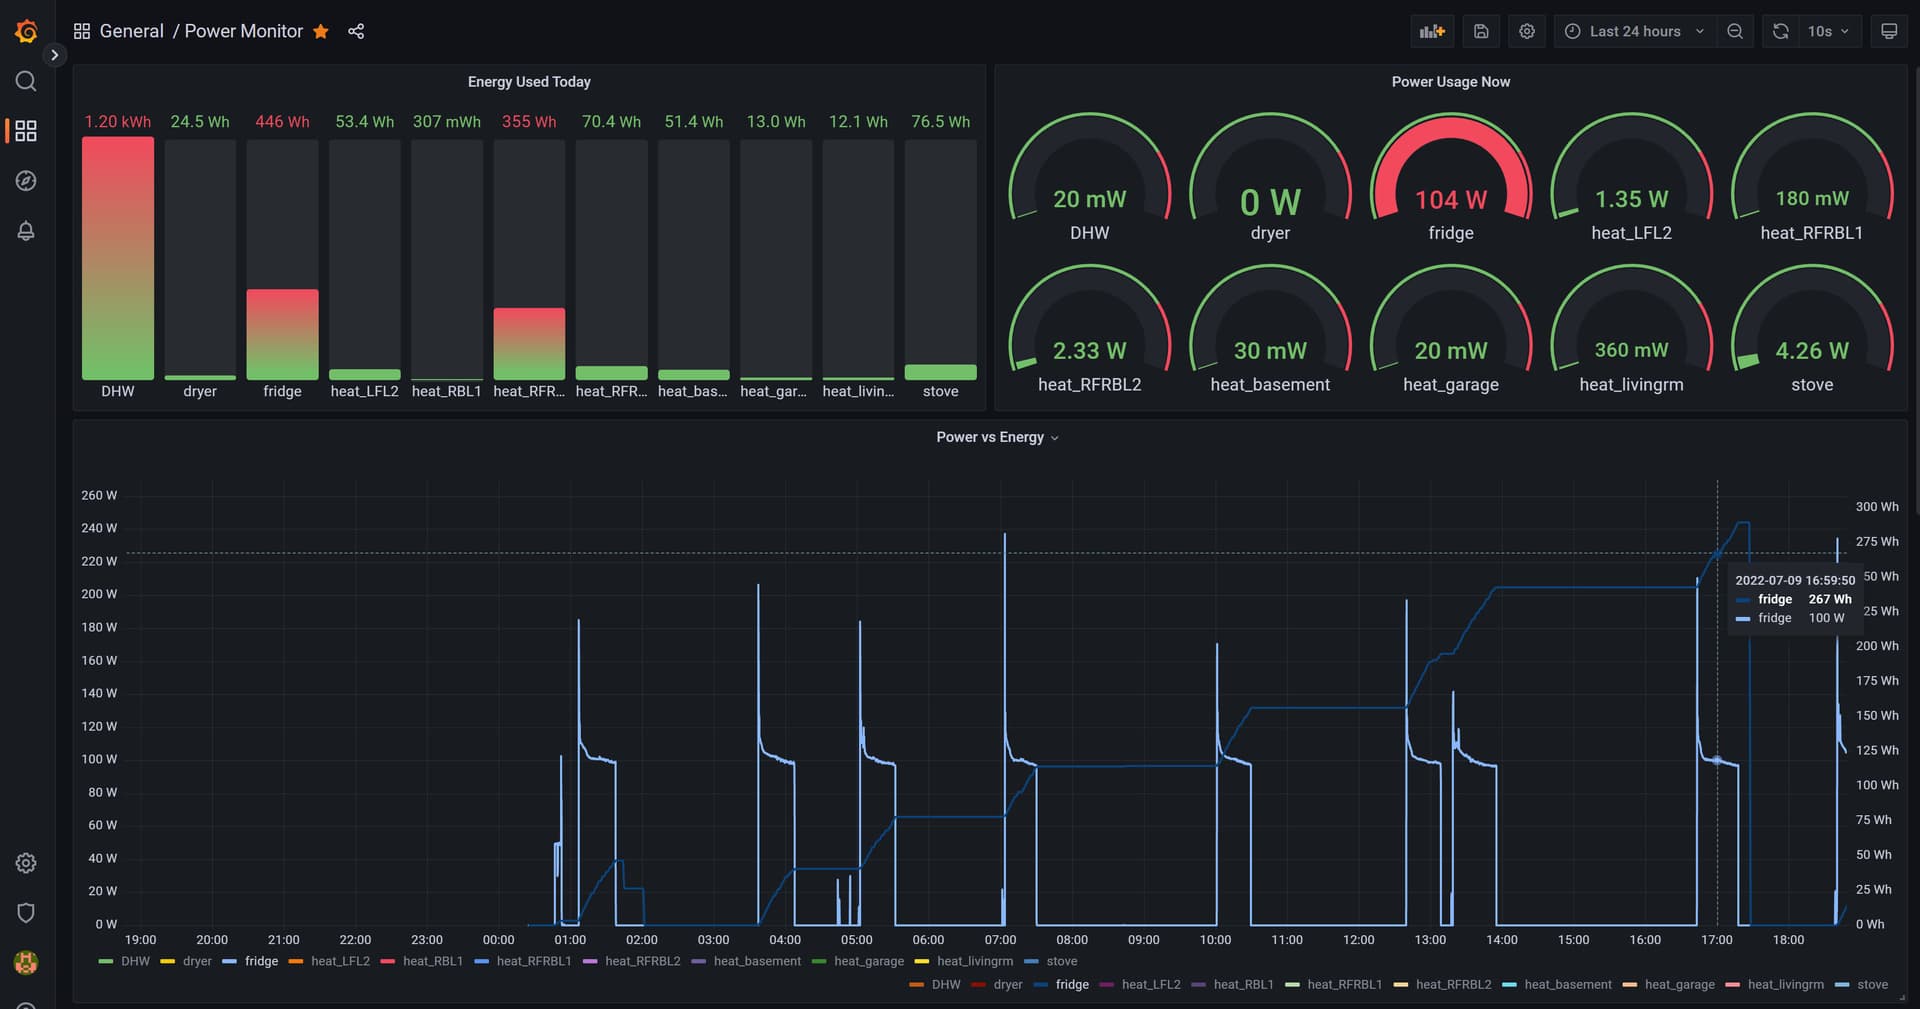
My application is monitoring my home’s hvac & DHW. I’m planning an energy retrofit & hvac upgrade. My first step is measuring exactly how much energy is used to heat the place (all electric baseboard heaters). Monitoring the heating circuits should give me exact heat-loss per room/zone. Then I can monitor a future heat-pump to track its efficiency.

Since its not heating season at the moment, I used some CT’s for a few large appliances and will change them over to heating circuits later.

Here’s my dashboard so far:

Here are the queries:
(I’m new to influxdb2/flux too, so if you see any improvements I could make, let me know! and share your best/most useful charts
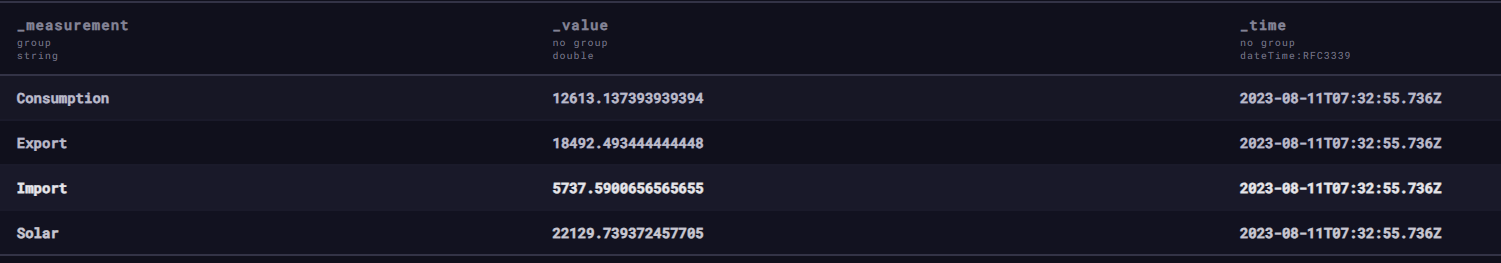
 :slight_smile:

Energy used today:

from(bucket: "power_monitor")
  |> range(start: today())
  |> aggregateWindow(every: 1h, fn: mean, createEmpty: false)
  |> keep(columns: ["_measurement", "_value", "_time"])
  |> increase()
  |> last()

Power usage now:

from(bucket: "power_monitor")
  |> range(start: -3m)
  |> keep(columns: ["_measurement", "_value", "_time"])
  |> last()

Power vs Energy:

power_watts =from(bucket: "power_monitor")
  |> range(start: v.timeRangeStart, stop: v.timeRangeStop)
  |> keep(columns: ["_measurement", "_value", "_time"])

energy_Wh =  from(bucket: "power_monitor")
  |> range(start: v.timeRangeStart, stop: v.timeRangeStop)
  |> aggregateWindow(every: 1m, fn: mean, createEmpty: false)
  |> map(fn: (r) => ({ r with _value: r._value / 60.0}))
  |>increase()
  |> keep(columns: ["_measurement", "_value", "_time"])

**panel override options used to change chart axis & units

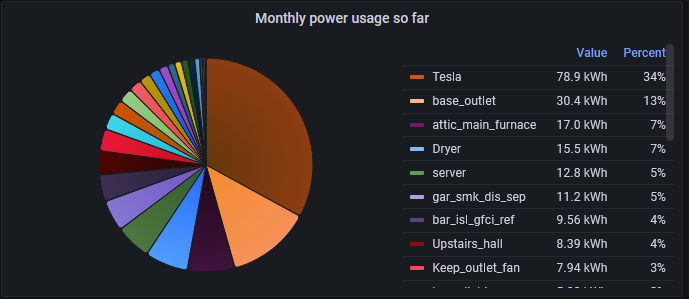
I don’t yet have enough data for longer term charts. I’m interested in daily & monthly KWh per circuit.

Unfortunately, there was no space in my panel for monitoring the mains, so I have 2x 200A CT not being used… :frowning:

Cheers!

2 Likes

I’m adding integrations for upload. Should I upload both watts and Wh under the same ‘measurement’ tagged with different units, or should they be a separate measurement?

I’m just uploading watts (and volts) and integrating in Influx. I’m not quite sure how the IoTaWatt integrators are supposed to work in that mix, if they integrate values for the Watts over the interval, or if you have to upload the data as Wh.

I’ve broken down and just use text boxes and tables for my dashboards right now. I had some graphs before, but the graph style seems a bit clunky compared to Graph+ by my needs. Generally I start with a graph, and then try to figure out what it is telling me and simplify it down to that result.

Similar to you, I want current power, daily energy, and I also add in weekly energy. When I get better at Grafana I can hopefully do some cool trend graphs that give better visual presentation of the delta between daily and weekly.

i only record watts and volts
i have examples of how i perform integration for my ENERGY usage here from the live watts.

That’s a great idea! So do you have W and Kwh with different retention policies? I now have iotawatt uploading Wh data in addition to the watts, but they have to go into the same bucket that way, so can’t have different retention policies… maybe I will set up a task that saves daily KWh use for longer (infinite) duration.

@Tjootjim
I just tried Graph+ and am impressed! I wasn’t expecting such a great tool built in.

Yes, you could have different retention policies. The biggest advantage is that the your data sets for queries are much smaller which simplifies any processing you might want to do. For me, I run Influx in a VM and have plenty of storage to not need to worry about retention policy for a few years.

If I were to do it again, I might have done integrals by quarter-hour, as when my meter eventually gets replaced it will have a ToU function. Hourly is generally good, but there are a few things where I need to switch between W and kWh to understand what is going on.

One disadvantage of two different buckets is that (as far as I know) you can’t have a combined query. I would love to have a single table that shows each of my metered loads with power, hourly, daily, and weekly energy values. Not a big deal though.

(I do love Graph+. I have one load in a sub-panel (EV Charger) that I need to be able to pull out of my main panel numbers for them to be meaningful. If there was any way to have Graph+ do it, I would have skipped InfluxDB in all probability. I am glad to have Influx now though as a longer-term historian.)

i only record watts and volts. i integrate everything using Flux.

for my pie chart (note: once query per breaker)

import "date"

month = date.truncate(t: now(), unit: 1mo)

from(bucket: "home_energy")
 |> range(start: month, stop: now())
  |> filter(fn: (r) => r["_measurement"] == "house_power2")
  |> filter(fn: (r) => r["_field"] == "Breaker_2_W")
  |> filter(fn: (r) => r["tag1"] == "iotawatt.01")
|> aggregateWindow(
    every: 1mo,
    fn: (tables=<-, column) =>
      tables
        |> integral(unit: 1h)
        |> map(fn: (r) => ({ r with _value: r._value / 1000.0})))
|> keep(columns: ["_value", "_time"])
|> rename(columns: {_value: "Breaker 2 - Dinning Room Outlets, Front Porch, Upstairs LR outlets along stair case, Upstairs Bathroom Right GFCI", _time: "Date"})

for my hourly per breaker (note different query per breaker)


from(bucket: "home_energy")
|> range(start: v.timeRangeStart, stop: v.timeRangeStop)
  |> filter(fn: (r) => r["_measurement"] == "house_power2")
  |> filter(fn: (r) => r["_field"] == "Breaker_2_W")
  |> filter(fn: (r) => r["tag1"] == "iotawatt.01")
|> aggregateWindow(
    every: 1h,
    fn: (tables=<-, column) =>
      tables
        |> integral(unit: 1h)
        |> map(fn: (r) => ({ r with _value: r._value / 1000.0})))
|> keep(columns: ["_value", "_time"])
|> rename(columns: {_value: "Breaker 2 Total Energy", _time: "Date"})

for my power draw since start of the month

import "strings"

month = time(v: "${strings.substring(v: string(v: now()), start: 0, end: 8)}01T00:00:00Z")

from(bucket: "home_energy")
|> range(start: month, stop: now())
|> filter(fn: (r) => r._field == "Mains1_W" or r._field == "Mains2_W")
|> pivot(rowKey: ["_time"], columnKey: ["_field"], valueColumn: "_value")
|> map(fn: (r) => ({ r with _value: r.Mains1_W + r.Mains2_W }))
|> aggregateWindow(
    every: 1mo,
    fn: (tables=<-, column) =>
      tables
        |> integral(unit: 1h)
        |> map(fn: (r) => ({ r with _value: r._value / 1000.0})))
|> keep(columns: ["_value", "_time"])
|> rename(columns: {_value: "Total Energy Uage Per Day", _time: "Date"})

for my charges per month

import "strings"

month = time(v: "${strings.substring(v: string(v: now()), start: 0, end: 8)}01T00:00:00Z")

from(bucket: "home_energy")
|> range(start: month, stop: now())
|> filter(fn: (r) => r._field == "Mains1_W" or r._field == "Mains2_W")
|> pivot(rowKey: ["_time"], columnKey: ["_field"], valueColumn: "_value")
|> map(fn: (r) => ({ r with _value: (r.Mains1_W + r.Mains2_W) * 0.14552 }))
|> aggregateWindow(
    every: 1mo,
    fn: (tables=<-, column) =>
      tables
        |> integral(unit: 1h)
        |> map(fn: (r) => ({ r with _value: r._value / 1000.0})))
|> keep(columns: ["_value", "_time"])
|> rename(columns: {_value: "Total Energy Uage Per Day", _time: "Date"})

for KW per day of the month

import "strings"

month = time(v: "${strings.substring(v: string(v: now()), start: 0, end: 8)}01T00:00:00Z")

from(bucket: "home_energy")
|> range(start: month, stop: now())
|> filter(fn: (r) => r._field == "Mains1_W" or r._field == "Mains2_W")
  |> filter(fn: (r) => r["_measurement"] == "house_power2")
|> pivot(rowKey: ["_time"], columnKey: ["_field"], valueColumn: "_value")
|> map(fn: (r) => ({ r with _value: r.Mains1_W + r.Mains2_W }))
|> aggregateWindow(
    every: 1d,
    fn: (tables=<-, column) =>
      tables
        |> integral(unit: 1h)
        |> map(fn: (r) => ({ r with _value: r._value / 1000.0})))
|> keep(columns: ["_value", "_time"])
|> rename(columns: {_value: "Total Energy Uage Per Day", _time: "Date"})

for monthly usage over last 2 years

import "date"

start_date = date.truncate(t: -2y, unit: 1m)

from(bucket: "home_energy")
  |> range(start: start_date, stop: now())
|> filter(fn: (r) => r._field == "Mains1_W" or r._field == "Mains2_W")
  |> filter(fn: (r) => r["_measurement"] == "house_power2")
|> pivot(rowKey: ["_time"], columnKey: ["_field"], valueColumn: "_value")
|> map(fn: (r) => ({ r with _value: r.Mains1_W + r.Mains2_W }))
|> aggregateWindow(
    every: 1mo,
    fn: (tables=<-, column) =>
      tables
        |> integral(unit: 1h)
        |> map(fn: (r) => ({ r with _value: r._value / 1000.0})))
|> keep(columns: ["_value", "_time"])
|> rename(columns: {_value: "Total Energy Uage Per Day", _time: "Date"})

I would recommend making a bucket for the integrated energy values. I do mine hourly.

Also, if you want kWh from W you can use 1000h and skip the math line.

I’ve taken some of the code here and adapted my own pie chart. I would like to add a 3rd column to the tabular output that would simply be the value * cost per KWH from my utility. Can’t seem to figure out how to modify this to get influx to return another column with simple math applied so I can have value, %, and cost in the table.

image

import "date"

month = date.truncate(t: now(), unit: 1mo)

from(bucket: "iotawatt")
 |> range(start: month, stop: now())
 |> filter(fn: (r) => r["device"] == "iotawatt1" or r["device"] == "iotawatt2")
 |> filter(fn: (r) => r["_measurement"] == "AC_Comp2" or r["_measurement"] == "AC_comp" or r["_measurement"] == "Dryer" or r["_measurement"] == "Family_room" or r["_measurement"] == "Keep_outlet_fan" or r["_measurement"] == "Kitchen_lights" or r["_measurement"] == "Master_bedroom" or r["_measurement"] == "Mbath_septic_jacuz" or r["_measurement"] == "Micro_upstairs" or r["_measurement"] == "Oven" or r["_measurement"] == "Private_bedroom" or r["_measurement"] == "Tesla" or r["_measurement"] == "Upstairs_hall" or r["_measurement"] == "Washing_machine" or r["_measurement"] == "attic_main_furnace" or r["_measurement"] == "bar_isl_gfci_ref" or r["_measurement"] == "base_ac_comp" or r["_measurement"] == "base_ac_furn" or r["_measurement"] == "base_lights" or r["_measurement"] == "base_outlet" or r["_measurement"] == "bedroom_1_2" or r["_measurement"] == "dining_foyer_porch" or r["_measurement"] == "fporch_left_right" or r["_measurement"] == "gar_smk_dis_sep" or r["_measurement"] == "server")
 |> aggregateWindow(
    every: 1mo,
    fn: (tables=<-, column) =>
      tables
        |> integral(unit: 1h)
        |> map(fn: (r) => ({ r with _value: r._value})))
 |> keep(columns: ["_value", "_time", "_measurement"])

I’m very much a beginner with flux (much prefer sql type languages) but this thread might help.

I think the syntax you need is the last.entry even if you are just using one bucket

https://community.influxdata.com/t/create-new-column-to-store-calculation-of-two-fields-from-different-buckets/20446/6

try something along the lines of
|> map(fn: (r) => ({ r with Cost: r._value * 0.455}))

where your cost goes where the 0.455 is. add this above the last “keep” line and add change the keep line to

|> keep(columns: [“_value”, “_time”, “_measurement”, “Cost”])

i can try seeing if i can get a working table using my own data tonight and see what i can get to work

Hope this is still relavant, but i like this bar chart and copied it into my setup, but my figures show a running total, not daily!
Is there anything else you do in grafana (or influx) im missing.
Thanks

that should guarantee it resets everyday… I don’t know what the problem could be, other than maybe the specific restart time isn’t what you expect. You can try changing the start time to see how it affects your chart. try “start: -12h” which should add up all values over the past 12 hrs

1 Like

Thanks
Ill play around with it some more - I would have assume today() was midnight to midnight of current day??
Just to be sure, my data is sent to influx in watts?

Cheers - ill keep digging

Bit more progress
I needed to add TimeZone to my query - even tho i had it set to local
The figures now are lower than Graph+ by a substantial amount
heres my query

import "timezone"
option location = timezone.location(name: "Australia/Sydney")
from(bucket: "iotawatt")
  |> range(start: today())
  |> aggregateWindow(every: 1h, fn: mean, createEmpty: false)
  |> keep(columns: ["_measurement", "_value", "_time"])
  |> increase()
  |> last()

From Influxdb table:


This is using Simple Table and the time is incorrect, but switching to Table, and the times are correct.
The figures show the same for both tables
And data from Graph+
Solar:

As you can see the total sum from iotawatt is very different to that of influx - This is the part that still has me scratching my head