The Query API allows power input data to be downloaded in a variety of units. Could you please provide details on which of these are actually recorded and which are derived? Am I correct in assuming that only time stamp, voltage (rms over the 5 second aggregated sampling interval) and frequency (from the voltage input), and current (rms over the 5 second aggregated sampling interval) and power factor (cosine of the phase difference between voltage and current signals) are recorded at every five-second interval?
If so, then watts and va would presumably be:
watts = voltage * current / (power factor)
va = voltage * current
var = voltage * current * (sine of phase) [where phase is obtained as inverse cosine of the power factor]
Is that correct?
How are the energy quantities (wh and varh) calculated? Are they just the corresponding power quantity multiplied by (5 / 3600) so that they can be added to estimate cumulative energy usage / generation?
For each interval (5s current log, 60s history log) the log record contains:
UTC timestamp
Cumulative monitoring hours since since commissioned.
For each voltage channel:
Cumulative Vh
Cumulative Hzh
For each power channel:
Cumulative Wh
Cumulative Ah
From this data, the following metrics can be computed for any interval defined by the two bounding datalog records:
Average Volts
Average Hz
Average Watts
Average VA
Average Pf
Wh
VAh
Var is computed as sqrt(VA^2 - Watts^2)
Varh is computed as sqrt(VAh^2 - Wh^2)
Var and Varh metrics are not reliable much beyond intervals of 5 or 10 seconds. (plotting an hour or so). If you need Varh, I would recommend uploading Var to influx and integrate Varh with a query,
Thanks for the details. Does the “cumulative” for the voltage and power channels mean cumulative across the 5s sample aggregation window, or cumulative since the first sample for that channel? If the latter, why record cumulatively? This is particularly surprising considering that the Wh quantities that can be graphed or retrieved via the API are not cumulative?
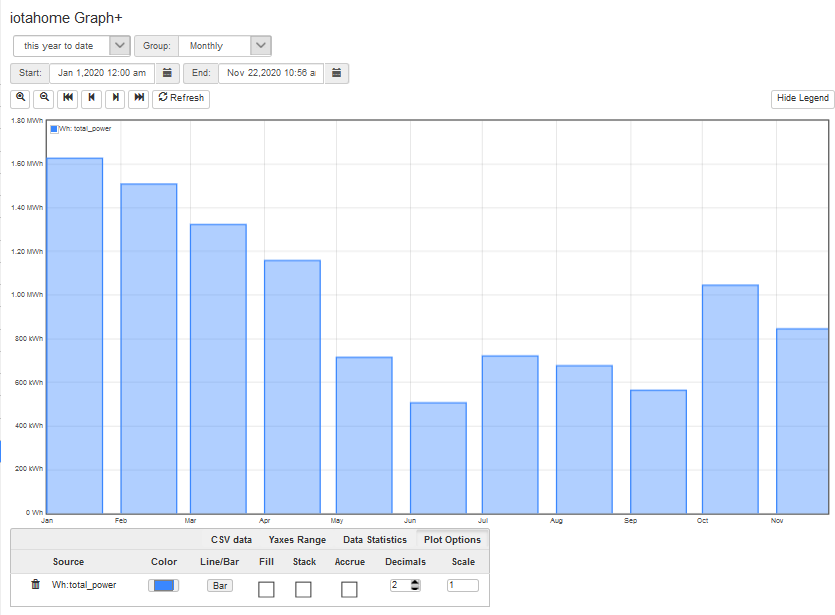
Well, they can be if you check the “accrue” box in graph+, but lets look at the mechanics. If you save the discrete Wh (or Watts) as opposed to cumulative, how do you do this? It’s true that the month to month values plotted are not cumulative, but the value for each month is the cumulative value for the month.
We’re looking at total Wh (kWh) used each month of this year. This query takes about half-second. There are about 5,700,000 indvidual datalog records for this period. Each month is about half-million records. If each record contained discrete Wh as opposed to cumulative, this plot would require reading 5.7 million datalog records and adding them up. That would take a little longer than half-second.
When we save cumulative Wh, we can get the above plot by reading 13 datalog records. So that’s 13 vs 5.7 million. I hope that answers your question.