I will say that we call it a work of Santa’s Elves. 
Glad that things seem to be fitting into place for you now. Merry Christmas.
I will say that we call it a work of Santa’s Elves.
Glad that things seem to be fitting into place for you now. Merry Christmas.
That works for me!
@FigGhost, checking in to see how the EmonCMS dashboard is coming… Any new screenshots or updates you have made in the recent days?
No changes yet, I got into some other things I needed to do here, and of course the holiday stuff.  Thanks for asking!
Fully understand life. Keep us in the loop when you have a update.
Will do! I’d like to have some dials that show things like total un-monitored power use, as well as trying to figure out if I can create a dial or something else that would indicate a specific device is likely running on one of the branch circuits, based upon its known power load when it is on. Something like a notch filter, that goes positive when a minimum power load value is sensed, but otherwise would indicate an off condition. I thought perhaps I could make use of minimum dial values in that regard, but so far just an idea.
I often use MIN and MAX daily values for future trending, etc. The dials I have you can include either a min or max value as well as the current. That way I know if a device like a fridge or other load was used in a given day. For example, I can see daily when my freezer does its defrost for 4 minutes and then back to normal operation. So with Min/Max I can see some of the trending. I have not used them, but I wonder if you can use an LED (in the dashboard) to trigger or light ON when a value over a set amount it reached.
I have a new gremlin. Although the IotaWatt is clearly and correctly showing that our heat pump and furnace are NOT running, Emon’s dashboard dials for them are intermittently showing 0 and then the maximum (that I have seen) values for them, on a regular cycle, over and over???
Our power was out this morning for about half an hour. Once it came back on, I waited about another half hour to start the emonpi server again (running on a PiTop). I just looked and all the feeds are many hours delinquent (I caught it updating at -14 hours) and counting backwards. The data showing in each feed is cycling at the same rate mentioned above, so I guess what I was seeing on Emon’s dashboard with the alternating values was the catch-up going on in real time. But I don’t know why the data would have been stopped over 14 hours ago, unless possibly something got corrupt when we lost power?
I like your LED idea. But I just tried one, and I don’t see any way to configure its color or what values I could assign to trigger a color change. I’ll have to look in the Emon manual about LEDs. Currently, it is alternating red and green as the values catch up on the heat pump feed I assigned it to.
The only scattered references to the LED I can find seem to indicate it was a proposed idea that never actually got fully fleshed out. That may be why I can’t find adjustments to set to make it useful.
Hmm. I observed something potentially similar in the message log of another user while looking into a WiFi issue. Not sure but may have been a piTop as well.
IoTaWatt queries Emoncms for the time of the most recent inputs and restarts upload from there. Is it possible that the Emoncms is keeping the latest values in memory and not on SD, so that it is restarting with old time stamps? I think some installations use Redis, and wonder if the inputs database is kept there in memory.
I’m out of my comfort zone here with Emoncms, but I’ll ask the Emon folks if that is a possibility and if so there is a way to force the times to permanent storage.
@overeasy. To the best of my understanding, the Pi install of EmonCMS stores everything necessary to disk (SD card) much like a regular computer system would with solid state storage. There are specific commands during the install to reduce the number of writes and reads to keep the SD card in top shape, but I’m not sure this would impact what they are seeing here. I do know that the basic install does request one install Redis as you said, but I never have to interact with it myself.
@FigGhost, maybe instead you leverage a new feed as the inputs allow for conditionals such as greater, less than, and equal. Log when a given input reaches above or drops below a given value and if so, log that to a new feed. Again, this would all be in the input and I think you may be able to tie a LED to that newly created and logged conditional feed?
Thank you both for the replies. I don’t know anything about Redis except that it is possible a Windows installation does not use it. I never got my attempted Windows installation running, and ended up on the PiTop instead, using a downloaded image of emonPi. So I don’t know much about what was included in that image. I just know it worked.
An interesting possible solution to the LED issue. So basically the LED shows red when there is no value and green when there is a value? As suggested, I may be able to play with the feed calculations to get the desired result.
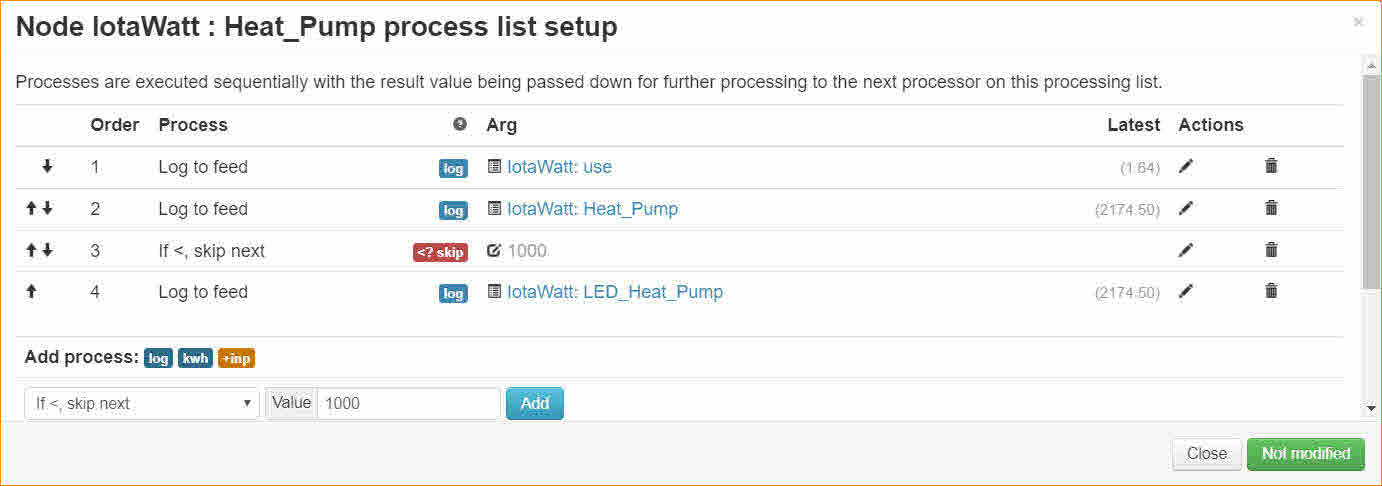
OK, I tried this, which as I understand it should skip process 3 if the step 2 value is less than 1000W, and log to the new feed LED_Heat_Pump if the step 2 value is greater than 1000W. But it doesn’t work. The LED remains black even when the heat pump is running and the dial shows over 2100W being used. Any ideas why? The only > and < operations seem to be to skip the next step. I don’t see an option to log a feed if the value is > or <. Unless I am missing something.
Well, I tried changing the LED feed to the Heat_Pump to make sure the LED is working, and it still remains black when the Heat Pump feed is 2174W. So now the LED option seems to not be working at all. Yesterday it worked, being red if no value, and green if any value.
So, if the LED does not work, does the log event occur for the LED_Heat_Pump? I played early on with the LED dashboard elements, but mostly focused on Min/Max and Current values. I assume the Heat Pump is logged just not the LED working with it?
It’s weird. The feed values carry through the processes OK, but an LED assigned to a feed value has a mind of its own, and only works “sometimes”.
For example, I have a feed that is slowly changing from 0W to 0.1W (electric range - not sure why it does this when not in use, unless maybe to update its clock?) and on it, an LED will work fine, showing red or green as expected for 0W or 0.1W. I have yet to see what it does if the oven or burner is on.
On my Heat_Pump feed, the values vary between 0W and about 2283W. An LED on that feed stays black and never changes color, regardless of the feed values. The feed values appear OK in the Input list, but the LED ignores them.
It also seems that any feeds including conditional processing (like to derive specific numbers I’d like to use for the LEDs) never work, and just stay black.
I’m doing more experimenting to try to find a workaround. But IMO, the LED option needs more work to be fully functional. I read different posts on the internet seeming to indicate that development on the LED function was stalled or nonexistent shortly after it was implemented. No one seemed to be addressing its needed programming.
Well, the LED appears to be a complicated thing! So far, I am finding that if you want it to work, the feed value you assign it to has to stay below 5.0. And, depending upon what value is used between 0 and 5, there are at least 5, and possibly more, different colors it can change to:
So far I have seen black (which seems to be a non-functional indication, red, magenta, green, blue (not shown here, but I did see it at one point today) and yellow. I think blue came in between values of 2 and 4 somewhere, but I don’t recall exactly where. So a simple implementation of "either red (off) or green (on) would be very difficult to achieve unless you know exactly what the main feed values are going to switch between so you could apply the correct math. The upside is that with the correct research and programming, I may be able to have an LED indicate, by color variance, whether the heat pump is cooling, heating, or defrosting, once I learn the specific power draw in wattage for each of those functions. I may also be able to determine the difference in hi/lo output stages of my 2-stage gas furnace tied into the heat pump as auxiliary/emergency heat by determining the wattage draw on the 2 different blower speeds it uses.
If there is documentation on the LED indicator, I would love to find and read it!
I was not even aware these were values from 1-5 for the LEDs. What you might be able to do is in your input use a conditional like you had where you set the LED for the heat pump value between 1 and 5 if the input is greater than the value you expect and a zero if less than. So, as you suggested. You could have it one color for different modes like you suggested. It would take some time to figure out the values, but with the graph, etc. you could pull them out.
If you have not checked with the EmonCMS forums, I would recommend that as well as there are some very dedicated people around specific of this tool. I had to go there a few times myself when I had a few questions on inputs. Maybe even some use of goto or other type of branching which I have not used.
Your dashboard is looking nice.
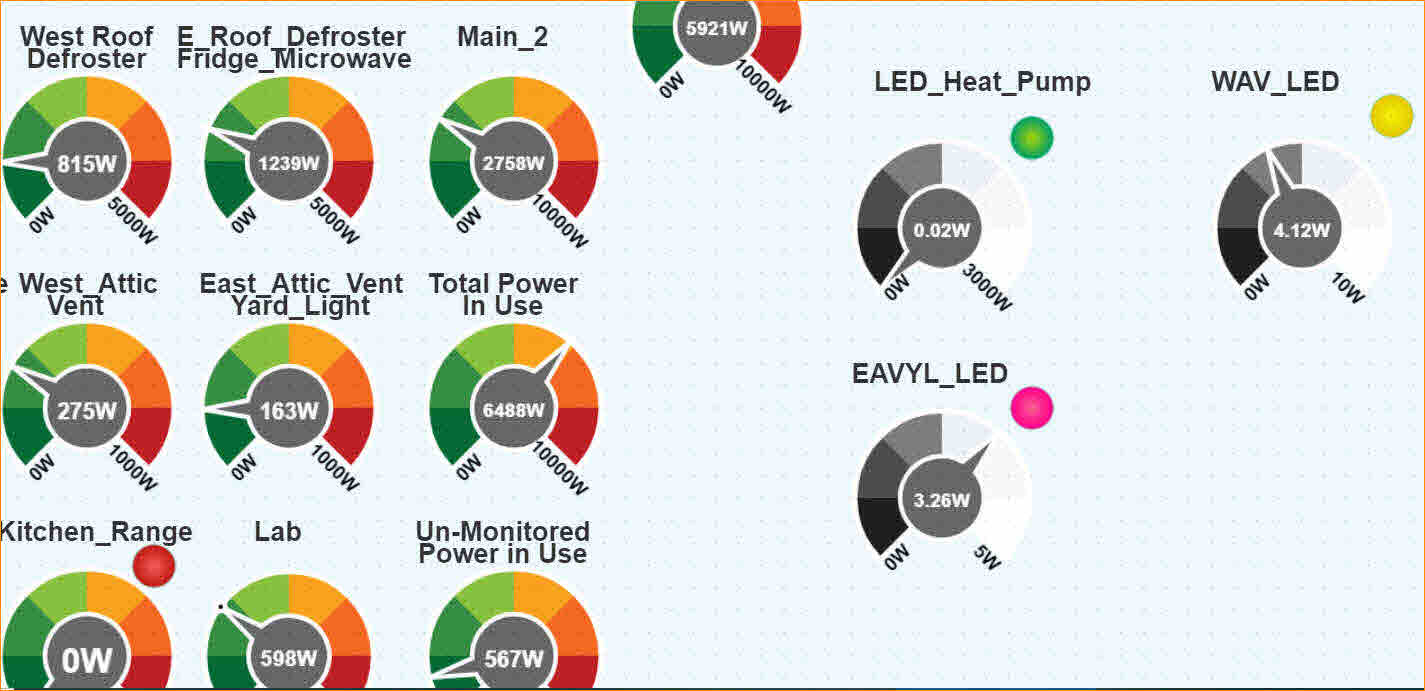
Thanks for the suggestions! It is definitely a work in progress, and the way I set the LEDs and black gauges to the side was just for testing purposes. If you notice the red LED at the Kitchen Range, nestled in between the text and gauge, that is what I have in mind for some of them. On this particular gauge, since the Range has distinctive wattage draws for different sized burners and the oven, I could put a circular arrangement of LEDs radial to the center of the gauge dial, with LEDs colored for burner size and oven when they light. It is easy to black out an LED… Just feed it more than 5 watts. So if I wanted I could use separate LEDs for the different color (wattage) values, and only light the desired color, or else just use one single LED that changes color based on value, with a small legend to decrypt the color meanings.
I’ve just thought of a way to suss out all possible colors. Start with something like the Range, which spends a lot of time on 0 watts. Add processes that add in some fraction of a watt repeatedly, like 0.1W, and log the subsequent increasing subtotal out each time to a new feed. Then make a column of LEDs with each one pointing at its own increasing subtotal feed value, and see what colors emerge. That would also reveal the trigger points to get each new color.
I did check with the Emoncms folks
Trystan confirms the issue with the Redis cache on SD systems and offers some pros/cons of various solutions. I will need to investigate more to see if there is a solution. In the meantime, it looks as if the downside with the current approach is a longer delay in recovery.
Ok, thanks for looking into that, overeasy. Fortunately, we don’t have frequent power outages here. But we have them now and then. As long as the data eventually catches up it won’t be a problem for me.