Hello,
If possible I would like to see decimal precision to 3 decimal places when using Graph+ for calibration purposes against my revenue meter in the circled figure.
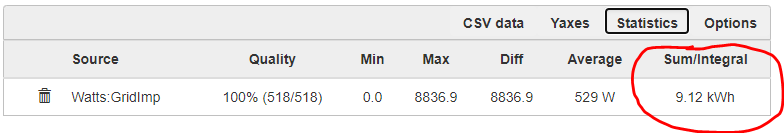
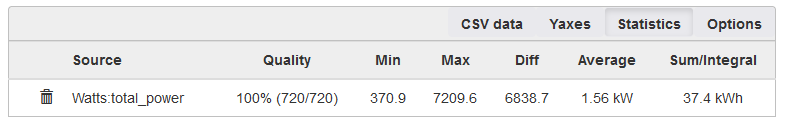
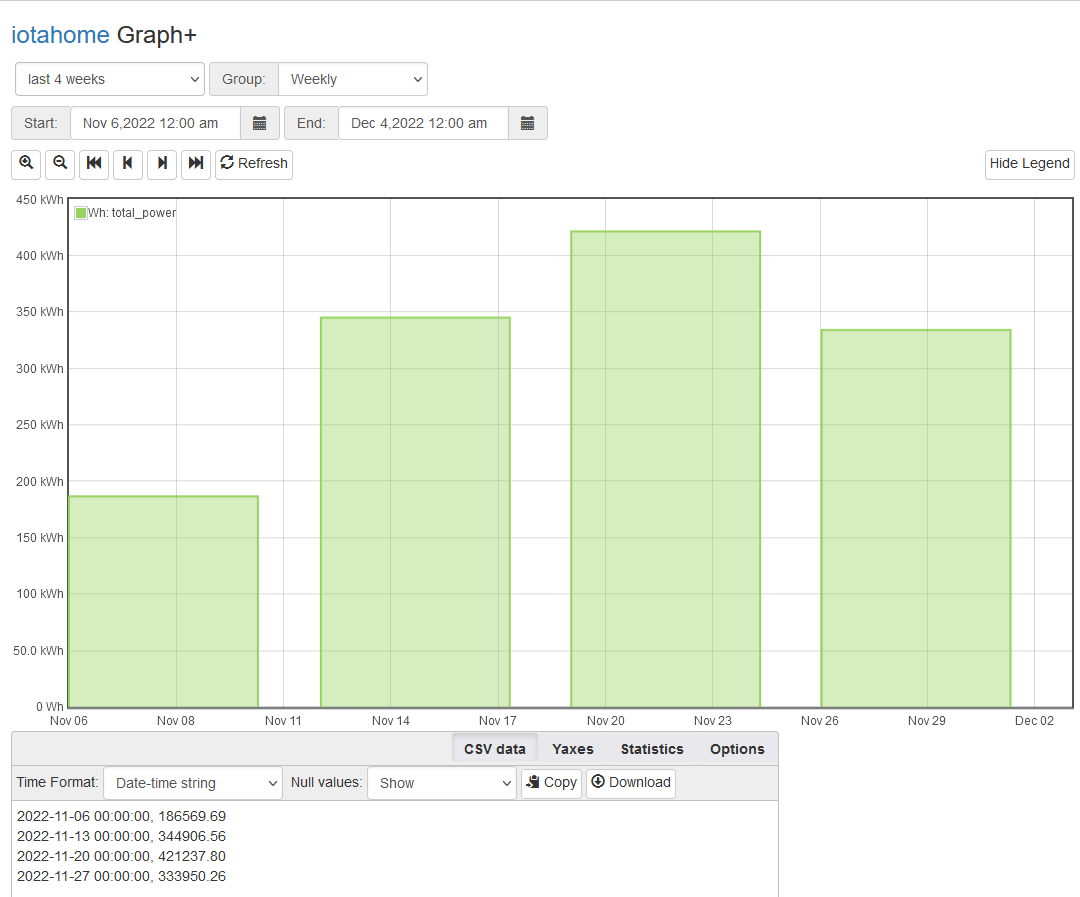
At present, when it’s below 10kWh I’m presented with 2 decimal places then 1 at 10kWh and above up to 100kWh and so on and I’d like it to be 3.
I found the table below in graph2.js which I am assuming is the correct place to make my proposed modifications?
I have asterisked the relevant lines that I plan to change. Can I make these edits without removing the SD card? If I make the changes will I be able to save them without extracting and editing the file on the SD on my laptop?
//*********************************************************************************************
// Table used to scale kilo, milli, etc with associated decimal precision
//*********************************************************************************************
var formats = [
{ max: 1, div: 0.001, prefix: “m”, dp: 0 },
*{ max: 10, div: 1, prefix: “”, dp: 2 }, CHANGE TO: { max: 10, div: 1, prefix: “”, dp: 3 },
*{ max: 100, div: 1, prefix: “”, dp: 1 }, CHANGE TO: { max: 100, div: 1, prefix: “”, dp: 3 },
*{ max: 1000, div: 1, prefix: “”, dp: 0 }, POSS CHANGE TO: { max: 1000, div: 1, prefix: “”, dp: 3 },
{ max: 10000, div: 1000, prefix: “k”, dp: 2 },
{ max: 100000, div: 1000, prefix: “k”, dp: 1 },
{ max: 1000000, div: 1000, prefix: “k”, dp: 0 },
{ max: 10000000, div: 1000000, prefix: “M”, dp: 2 },
{ max: 100000000, div: 1000000, prefix: “M”, dp: 1 },
{ max: 100000000000, div: 1000000, prefix: “M”, dp: 0 },
];
I’m asking before I break my IoTaWatt!
Thanks in advance.
Steve