Recently I deployed Iotawatt and want to feed pvoutput from it. Currently I use python script to read some cloud api from another metering system to do the same.
Once I deployed it, I made test account in pvoutput and started comparing result.
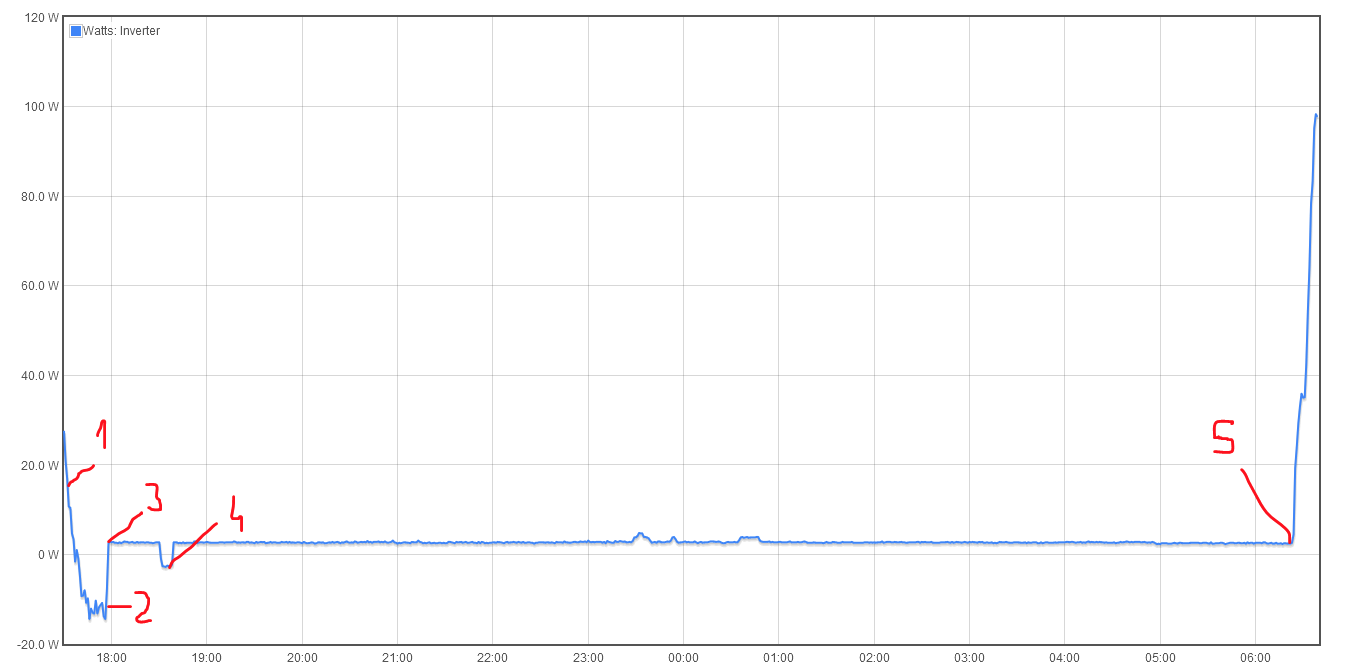
Trouble is that I have night “production” of 3W reported on my inverter cable. After some diagnostic run, I found:
it is current in this cable as turning fuse off stops this reading
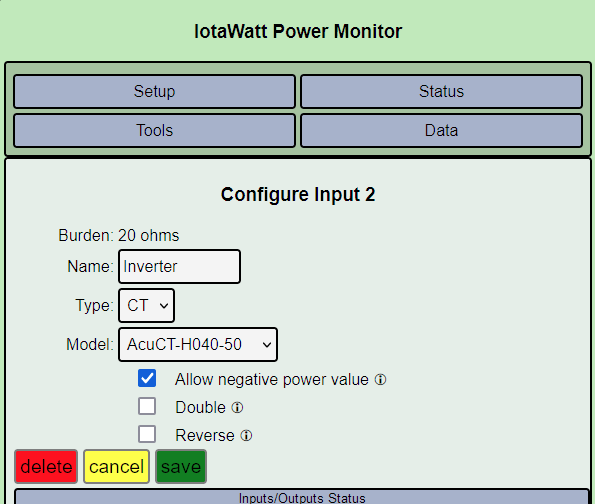
It is correct direction as it is the same as real production. I made it bidirectional and during minimum light it shows reverse direction of 5-20W but when inverter goes to sleep it remains solid 3W in production direction
It is certainly false positive as there is no energy in inverter at night.
I tried to alleviate issue by adding “(inverter -3) max 0”. This does prevent false power reading in pvoutput but energy reported by iotawatt still increases by 12Wh every 4h.
The only way I can explain this false reading is apparent power draw by some capacitance in inverter. As it would be turned 90 degrees, I can imagine further phase shift either in reference transformer or CT to be on the other side of 90 degrees making it wrong direction. However, this still does not make sense.
Any tips how to either fix, compensate or overcome this false reading?
If your three points are correct, it’s not a false reading. You say when you turn off the fuse, it goes to zero, and when you allow reverse it is still positive. Yet as you also say, producing energy in the dark would violate the law of conservation of energy.
So we have a paradox. My inclination is to double check the assumptions. It’s very common for an inverter to draw standby power. what I would suggest is that you set allow negative values for the inverter CT, and specify generation to PVoutput as
Solar max 0.
If the problem persists and generation during the day is positive, then post a plot of the inverter CT that covers both the night and day behavior.
Yep, I believe current is real just wrong direction found. This is why I thought it could be from reactance making it pf next to 0 and misreading direction by added phase shift made by CT.
It is already bidirectional and generation is positive when is real. There is also a bit of negative just before inverter goes to sleep.
OK, position 4 convinces me that the configuration isn’t the problem. However, there is some current being indicated. What you posted suggests you are 230V single-phase. If that’s the case, 3W would be ten or so mA primary. That’s 10 uA into the IoTaWatt. Not even a high end multimeter would pretend to accurately read that in a 0-50mA range.
I suppose its possible that a negative standby current is being phase shifted positive, but that would require a shift of more than 90 degrees. I don’t see that as likely. My guess is that it’s noise picked up by the CT cable.
Can you try rerouting it away from high-voltage cables to see if anything changes?
That is already done. In fact I installed this CT on neutral cable but still the same. I think the current itself can be substantially higher as what it shows is real power. If pf is, say, 0.05 as current runs via capacitance, then it could be explained. Thing is for capacitor which is nearly pure reactance pf would be nearly 0 and phase shift v/a nearly 90 degrees. Then 5 degrees forward or 5 degrees back and we have either positive or negative real power from it which is false anyway.
I’ll check current alone in this cable tonight, let’s see what’s there.
Do you know what to put into “generic” CT setup for this CT? I could try play with phase shift then. BTW - this shows pf 0.99 for inverter while runs at full steam and inverter reports pf 1.
Alright, I think I solved it but could save myself misery if I scrolled menu down.
I found what is used as embedded table for known inputs. Made CT “generic” and then shifted phase from original 1.0 to 1.7 until it got corrected. However, I also used “generic” reference trafo. As it may introduce shift to, I looked what is in embedded table and found that mine is actually listed. Changed it to “Powertech”, switched CT to what it is from the list and it seems correct for a while.
Tomorrow is another day with daylight, let’s see what will show up as now all CTs are shifted by 0.7 forward due to corrected voltage shift…
Power supplies and filters are outside my areas of expertise. Essentially your inverter appears to be drawing .5 Amp and then giving just about all of it back. It’s hard to imagine this not being a nightmare for power companies. What is the inverter brand/model?
On the bright side, IoTaWatt’s phase shift compensation appears to be working very well. While most electronic power meters are fine tuned for the shift of their fixed components, IoTaWatt uniquely allows using literally dozens of various VTs and CTs using table driven compensation values, and it appears to have worked extremely well here.
It is Goodwe GW10K-MS. Not many available with single phase 10kW.
Reactive power is a nightmare but is very common. Many switching PSUs are PF 0.6-0.7, dimmers make it even worse and lots of devices have filters drawing 10-200mA while they are off.
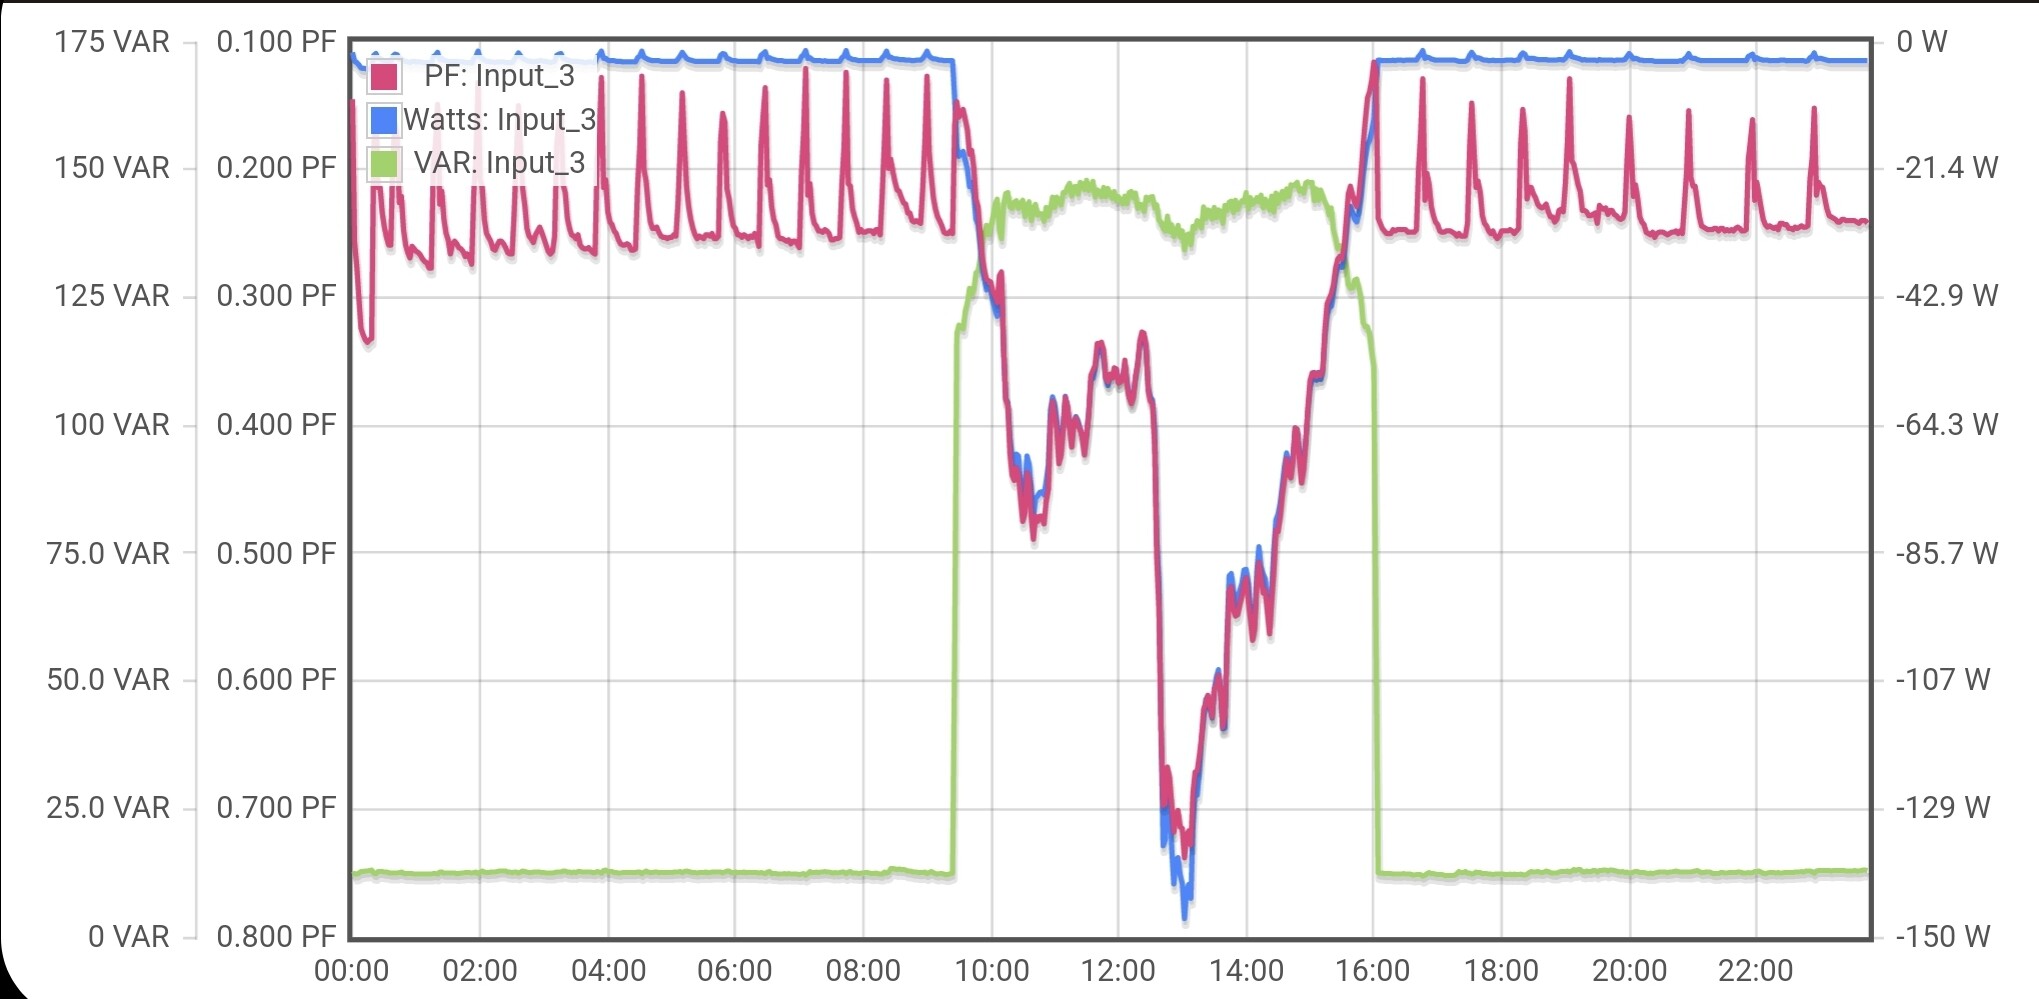
Found this thread and want to post here because I seem to be experiencing the exact same issue. I attached a graph with W, VAR and PF.
3 phase (relatively new) European system. Derived reference with the VT on phase A and PV system also on phase A. AccuCT 50A clamp on the live wire and Ideal VT, both selected from the list.
The PV system is set to allow negative measurements and I placed the CT clamp in the same direction as all of the others so the measurements are in the opposite sign (negative for production).
The inverter appears to generate 3W in the dark but following the discussion in this topic, it appears some kind of capacitive/reactive power draw. Now my question is of course, is there something I can do about this?
That was a long time ago. It doesn’t appear the question was ever resolved. The user started fooling around with defining generic CTs and VTs and manipulating the phase shift. Calibrating phase shift at 500 mA is folly. While even 5 Watts of erroneous power during the night may add up to 80 or so Wh/day, the error introduced by incorrect phase correction when the inverter is actually working could easily be much more than that.
I’m trying to understand why your PF chart has the scale inverted. Rather than plot PF and VAR, can you plot Watts and VA for that same period?
There’s also some kind of cyclic blip in your standby Watts and related PF. Does that correlate with anything happening in your mains?
Solar production of 100 Watts is not very much. You must be very far north. In any event, the starting point would be to compare Wh output as measured by the inverter vs IoTaWatt over several days. If they substantially agree, you will probably need to ignore the very low standby measurement.
It might also be helpful to switch off the inverter breaker during standby to see what happens.
Thank you for the (very) fast response! I’m indeed located rather north, I live in the Netherlands. These last few days specifically have been very cold and clouded.
Attached the requested plot. I must admit that I do not yet understand VA and VAR so I have some reading to do.
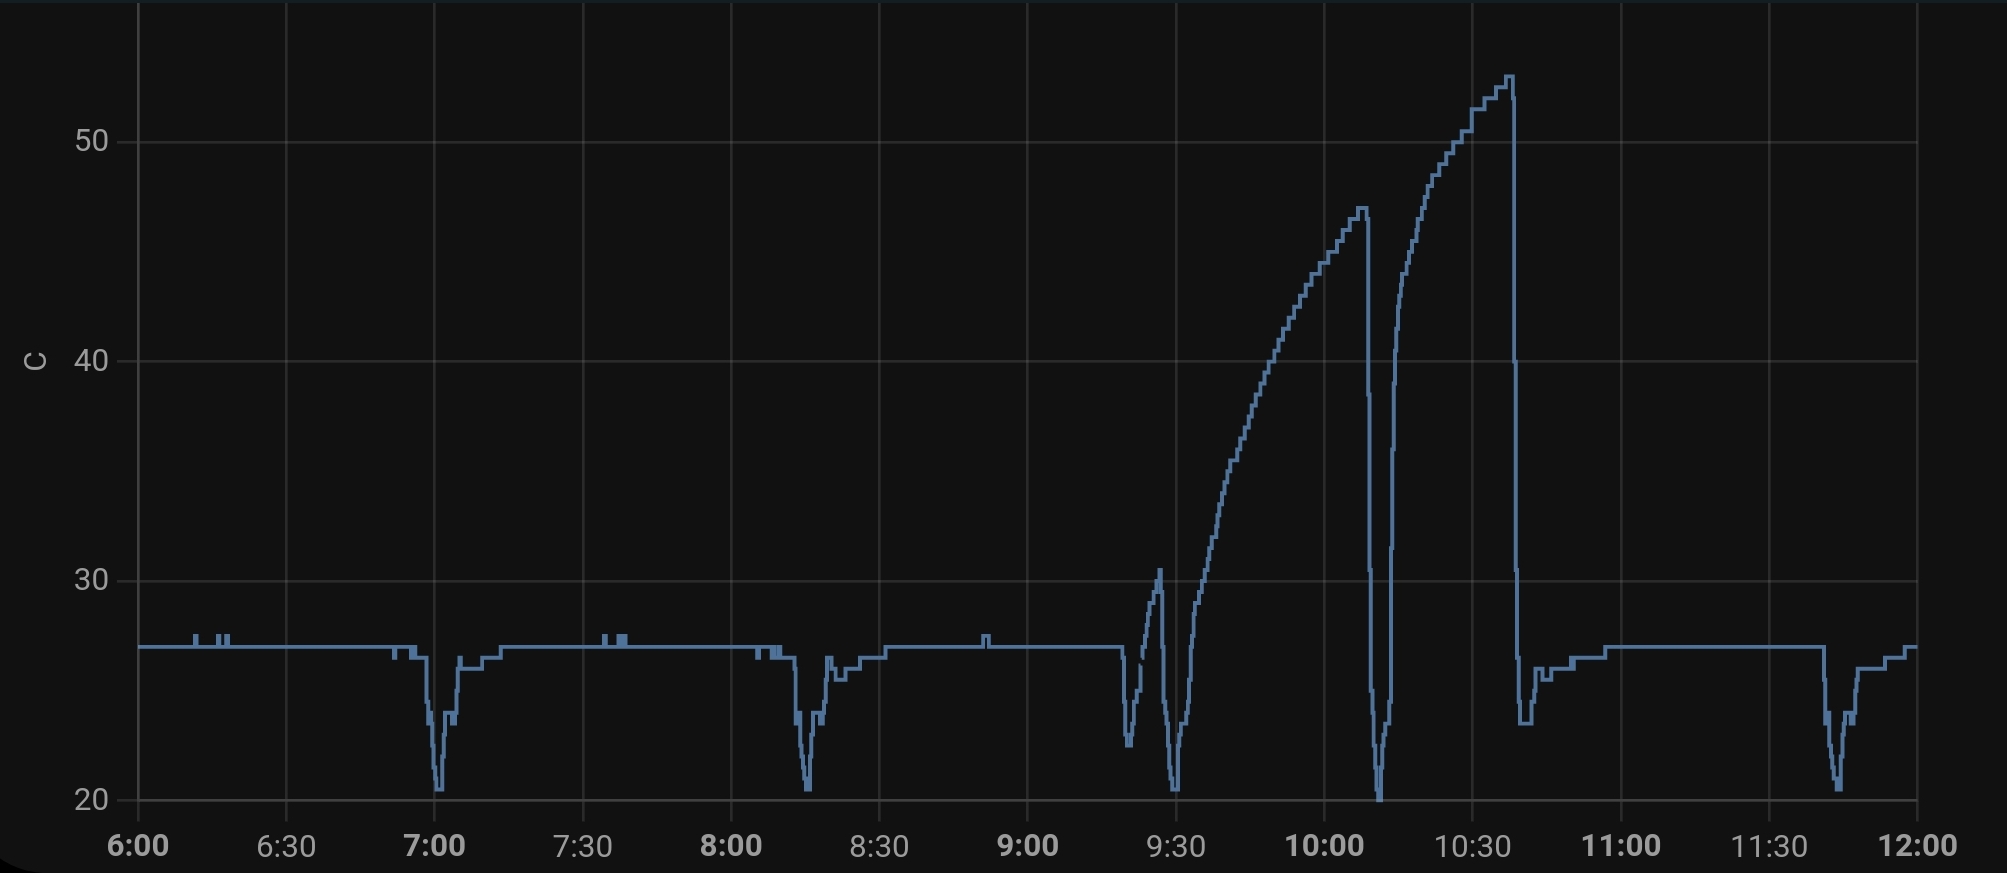
I noticed the pattern in the measurements as well, I will have to check the timing and see if it correlates with other processes in our house (we have a heat pump on the same phase). Also, I will try switching the breaker when the system is off. Will follow up!
Actually, the pattern does seem to align with the heat pump defrost cycle. When the temperatures are low as they are now - hovering around 0C day and night - there is often ice formation on the heat exchanger outside. So every hour or slightly more frequent, the heat pump reverses the cycle to remove energy from the house to heat up the outside heat exchanger and melt off the formed ice.
I have turned off the PV breaker and will let it run at least until I have seen another defrost cycle.
Edit: the PV reporting gives me only 110Wh and iotawatt gives me 455Wh for production yesterday. Might have something to do with the low power output and problems for the inverter to correctly measure and calculate the power output.