I have extreme spikes in the current sensors: SCT013-000 in a diverted tree phase configuration.
what could the issue be ?

I don’t know if there is enough room to list all the things it could be based on this limited information. Let’s try to narrow it down.
I’m going to assume that “diverted tree phase” is supposed to be “derived three-phase”. That’s not only because they kind-of sound alike, but because your graph starts out with negative power, which is typical in an improperly configured derived three-phase setup.
Installing derived three-phase is failrly simple, but you have to follow the instructions carefully. There are something like 42 combinations of phase assignment and CT orientation. Only one of them is correct. It’s easy to reduce that to a fairly small number by observing a convention installing all of the CTs the same way. The documentation explains how to work through phase assignment by trial and error with a high PF load.
Read through that at IoTaWatt Documentation
Then when you have done all of that, if you still have problems, post the setup input display, and a plot of the phases.
I have solar panels the yellow line is the solar the green is the power usage of the grid
Also autocorrection that spelled it to diverted instead of derived.
The phases should be in the correct order.
i also just added the 3 phase garden shed and this are the results:

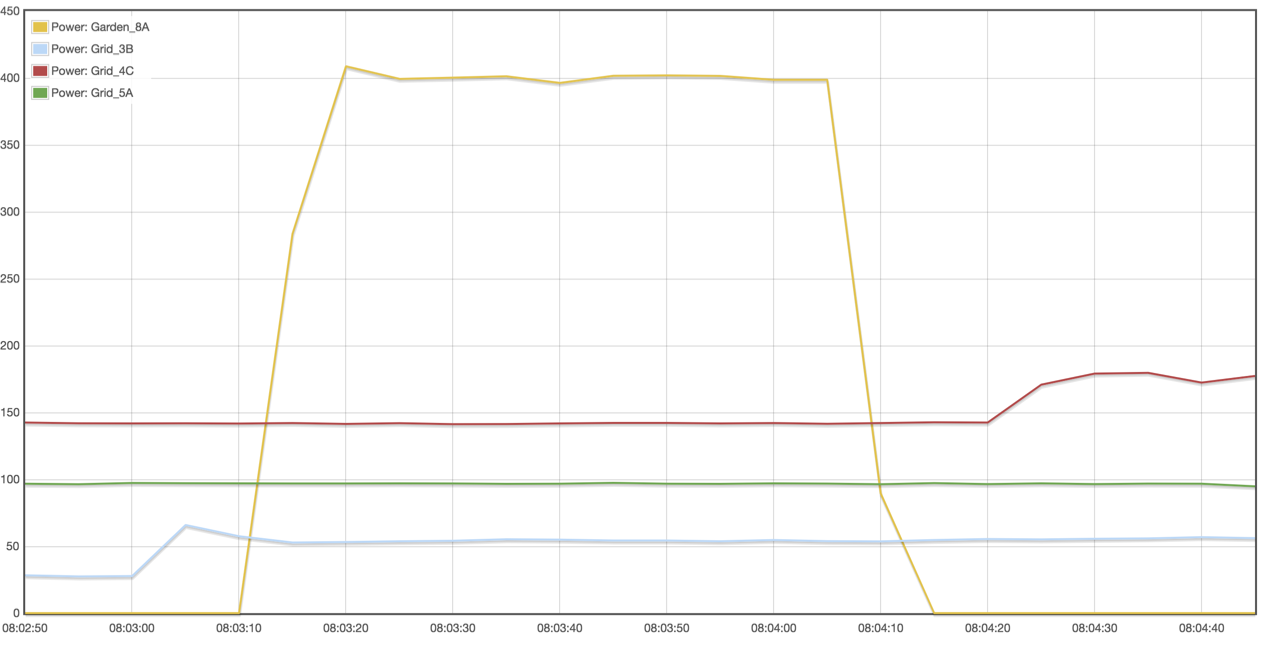
the yellow line and the red line are correct but the spikes should not be there on the blue line.
nothing is plugged in on the blue line (phase A)
So you are questioning the “spikes” on phase A? They are very rhythmic, occuring about every 73 minutes. Something that uses about 150 watts is coming on for a brief period. The plot shows different values for each “spike”, but I think if you were to zoom in with the + key they would even out.
IoTaWatt is plotting average power for each interval. You have a 24Hr plot there, so each interval is probably 2 minutes. If whatever it is does not run for at least 4 minutes, the periods will average out to less than the full load because it is zero for the rest of the interval. Try zooming in to 10 or 5 second intervals and see what they look like. It’s not even a big load. If you are in a 230V country, those power levels are hard to measure, especially if you are using something like SCT013 CTs.
But again, I don’t have a lot of information…
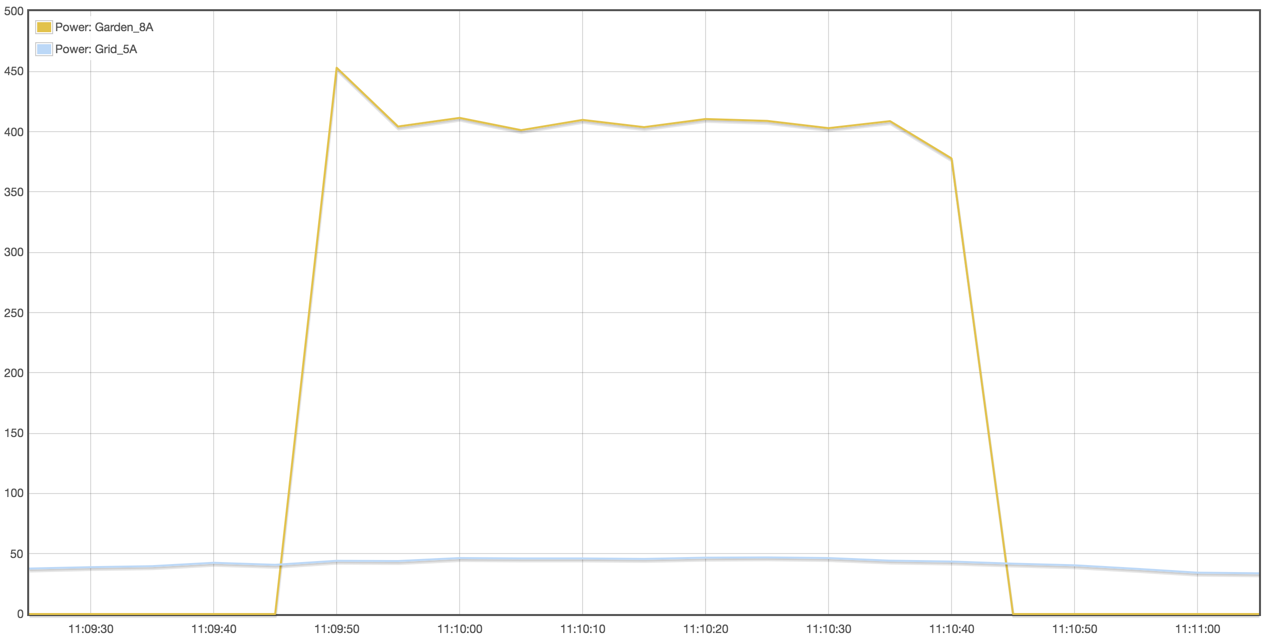
Doesn’t look like “interference” (I call it noise) to me. It has an inrush component, then runs for 45 or 50 seconds at 400 watts and stops. If I wanted to generate that kind of noise, I wouldn’t have a clue how to do it. I’d go out into that garden shed and have a look around.
That it doesn’t appear on the “Grid” plot suggests to me that this circuit is not on the same phase as that main, or the other possibility is that you are plotting that Grid with the right checkbox and it is being plotted at a different scale. Was there another scale on the right of the graph? The plot does seem to creep up a bit under that load.
I am 100% sure all the phases are correct also the spike is not on the grid channel B and C.
Ok. Take some pictures. Convince me.
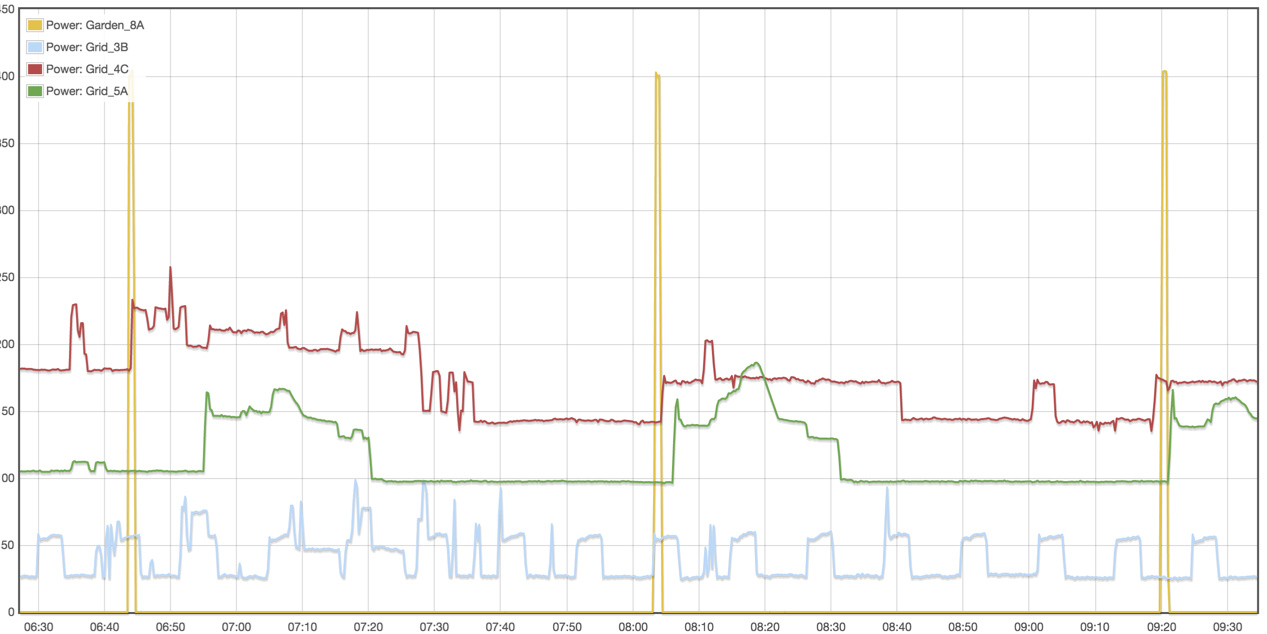
OK, I agree that the pulses on what is labelled Garden_6A do not appear in the plots of the inputs labelled Grid_np. So something is wrong. That these pulses are caused by something in the IoTaWatt is such a remote possibility in contrast to the universe of things that can be wrong in the installation, my instinct is to try and figure out exactly what is going on external to the IoTaWatt.
Here are a few things that I’d like to see:
- Good resolution pictures of the service panel showing the CTs installed for both the “Grid” and these Garden circuit in question, including the mains and load circuit breakers and how they are interconnected. It’s also important at this point to show the neutral conductors.
- Connect a significant resistive load to that Garden circuit and cycle it a few times for several minutes, then produce another plot like those above showing the same four circuits and also including one of those pulses along with the “real” load.
- Record the kWh usage from your meter and the kWh total of the three Grid circuits at the same point in time. We will want to compare that in a day or so.
- If the solar is feeding through the mains or meter, then include pictures and data for that as well.
Every problem has a solution. If the answer was obvious, it wouldn’t be a problem. This methodic approach usually proves to be the best way to resolve. Random guesses as to what it could be don’t produce optimum results as this could easily be a compound problem.
Would also be interesting to turn off circuit Garden 8A at the circuit breaker in the switchboard to be certain there is nothing connected somewhere on the circuit and see if the spikes still occur.