Just sharing an interesting use case in case it inspires ideas for anybody else, or in case anybody has ideas for me on better ways to accomplish this ![]()
TL;DR
I’m identifying when my hybrid car is charging and creating a pair of “split” outputs that isolates (approximately!) how much power is used by the charger versus the rest of the branch circuit it’s sharing.
Backstory
I’ve recently bought a plug-in hybrid Volvo, and am charging it (very, very slowly) using a standard 110V branch circuit in my garage (I’m in the USA). I’ve monitored my garage branch as a unique Input in the past since there’s also a freezer installed out there. Now with the hybrid EV charger, I’d like to get a rough estimate of how much energy is being consumed by the charger vs the rest of the branch circuit. Note that this solution is approximate only, but it gets me close and demonstrates a neat “thresholding” math trick in the Output calculator. A true/accurate measurement would require a dedicated circuit or separate power measurement equipment for that single load… neither of which I have today ![]()
Split Output Calculations
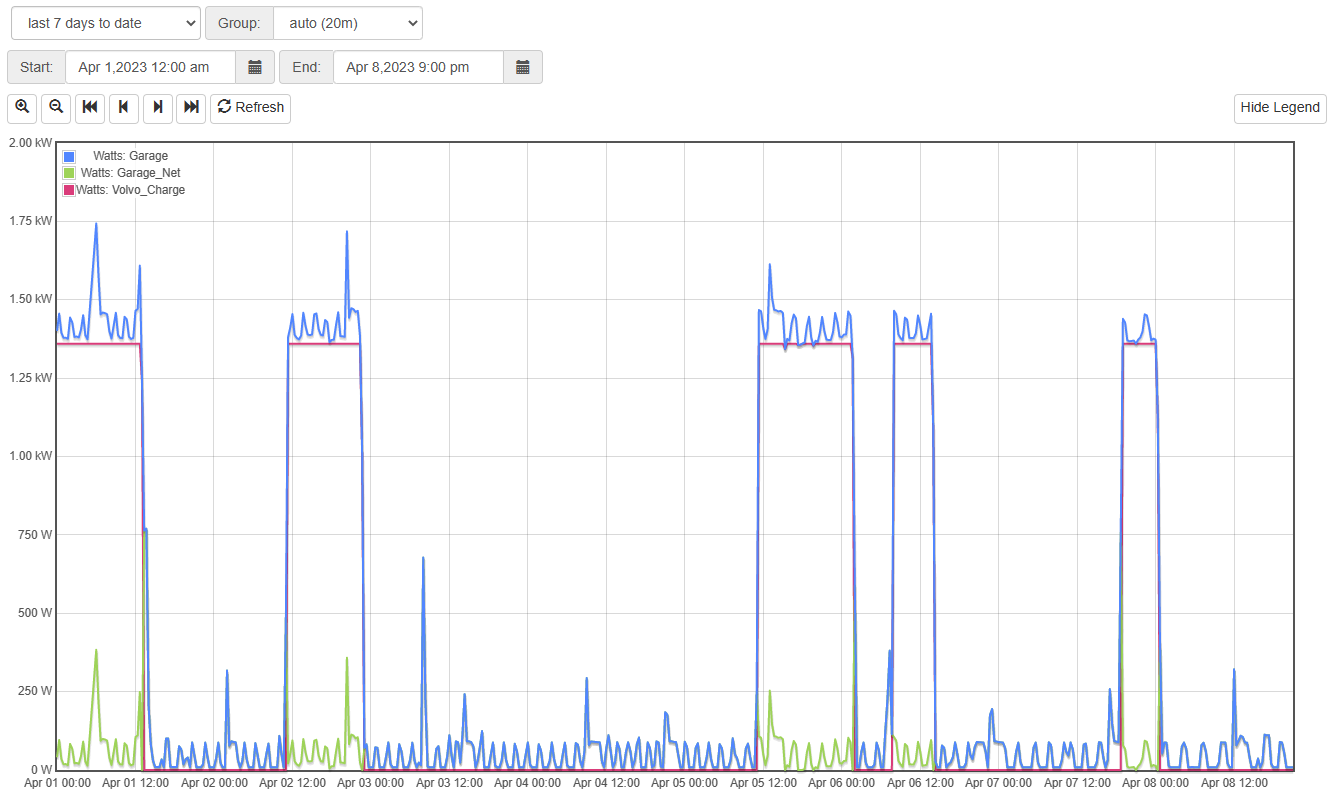
Here’s my “pure IoTaWatt” approximation to “split” this single circuit:
- Input
Garage(blue): branch circuit - Output
Volvo_Charge(green): If power draw is over 900W, then attribute all power up to a max of 1360W to the charger:
Watts = (Garage min 1360) x ((((Garage - 900) max 0) min 0.01) x 100) - Output
Garage_Net(red): The rest, after removing the charger:Garage-Volvo_Charge
Watts = Garage - ((Garage min 1360) x ((((Garage - 900) max 0) min 0.01) x 100))
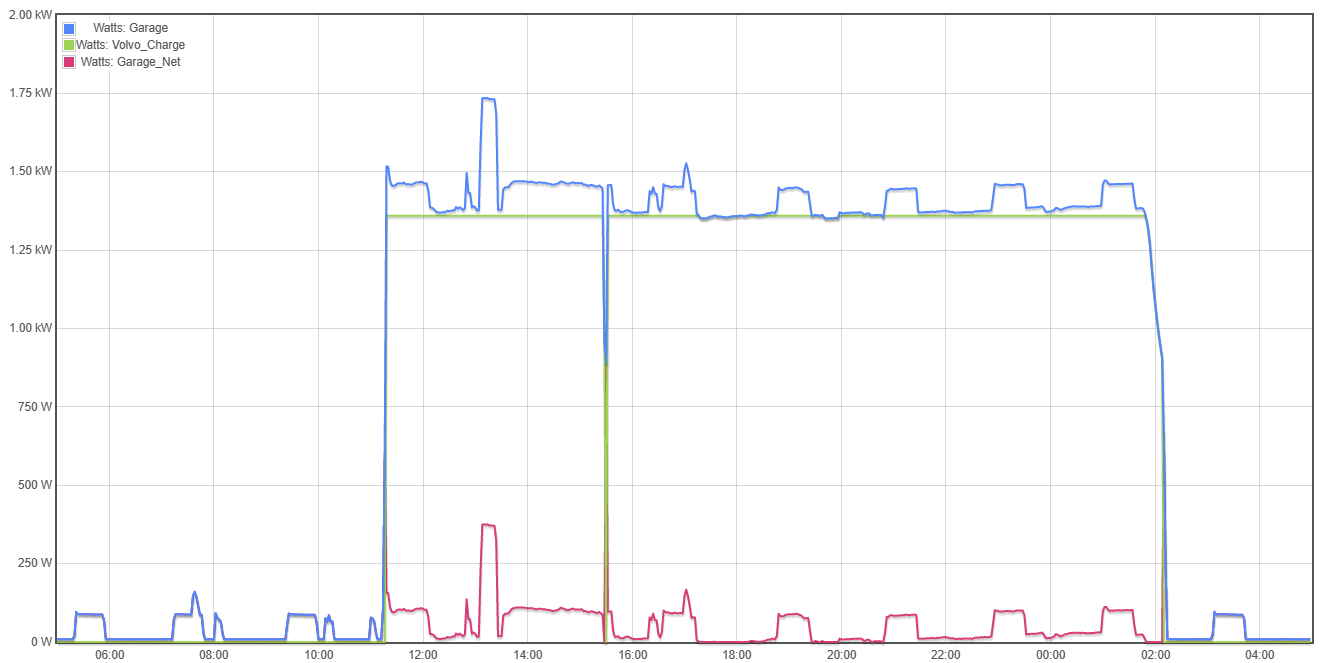
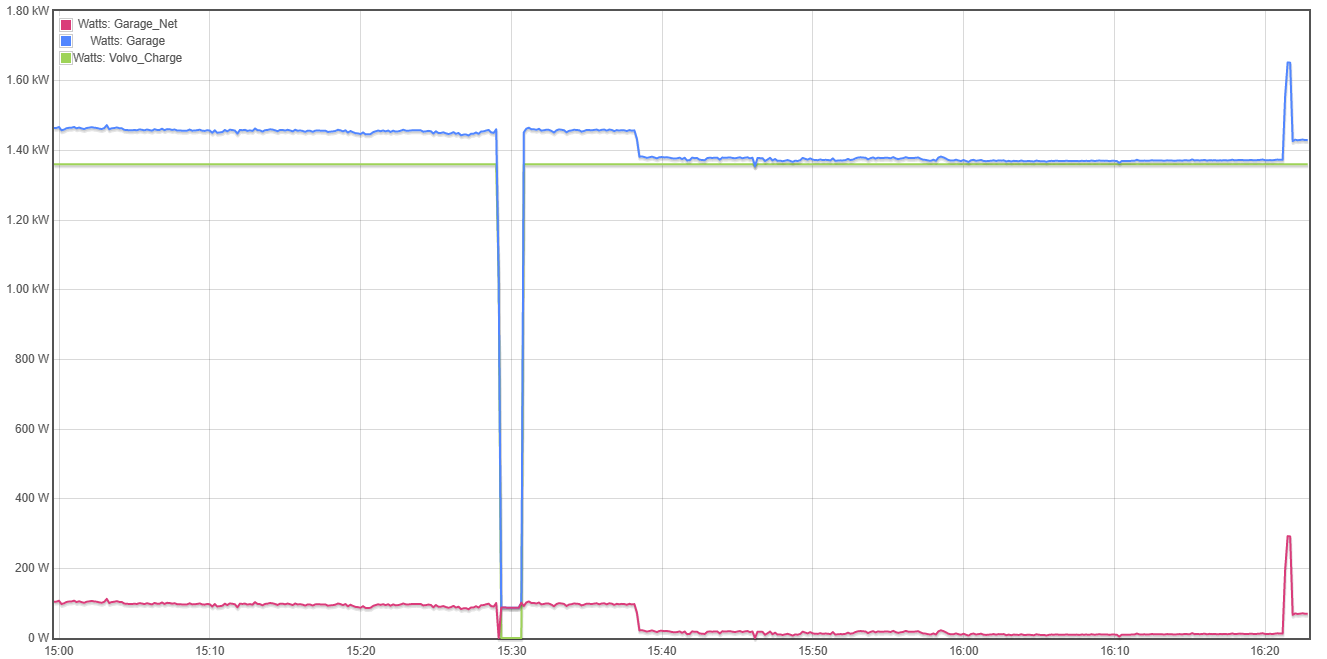
Note: even that “glitch” in the middle confirms the calculation approach… Zooming in, we can see that during this gap, the charger temporarily tripped off, and the Garage_Net line continues showing a fairly consistent power draw through the whole period:
How It Works
This approach deeply relies on the charger having a very consistent power draw that’s significantly larger than anything else on the circuit, so that I can sense it by the presence of high consumption, and then approximate it as a constant load.
In my case, I measured a few initial charge cycles and found that:
- Over the duration of the charge, the charger consistently draws 1370-1385 watts, and varies… but it only rarely dips below 1360 watts.
- At the end of the charge, the charger ramps down its power usage over approximately 30 minutes, and then turns off completely. Over this ramp period, the power draw remains above 900 watts. (Or at least in the charges I measured… Looking at the specific cycle in the graph above, it looks like I should nudge that threshold down just a bit.)
IoTaWatt does not do logic functions (e.g. “if less than X”), but it does offer min and max, which allow me to do some ad hoc thresholding. Breaking down the Volvo_Charge Output formula:
(Garage min 1360) x ((((Garage - 900) max 0) min 0.01) x 100)
- The right half of the multiplication will compute either
0or1depending on whether the total power is greater than900:- First, we subtract off the threshold (900W), and take the
maxwith0. For any value less than the threshold, this will bemax(negative number, 0), i.e. evaluate to0. For any value greater than the threshold, this will be some positive number showing how many more watts are being drawn. - Then, we take that the
minof that value and0.01. This leaves0as0, but cuts any “power used over 900W” value down to0.01. - Finally, multiply the result by
100, leaving either0or1(or in the unlikely (impossible?) event that the raw value was 900.005 or something, we’d end up with an intermediate value of50and a slight error for this data point in my math. I’m happy to ignore that minor edge case )
)
- First, we subtract off the threshold (900W), and take the
- The left half of the equation:
min(actual value, 1360)measures “all power up to and including 1360W, but no more”. - Multiply these together to get the “filtered” charger signal: (the charger’s attribution) * (1 or 0), based on whether the charger was on. This creates a resulting signal that consumes all power up to 1360W, but only if the power drawn is > the 900W threshold. Else it consumes 0.
For the Garage_Net output, just compute the difference:
Garage - ((Garage min 1360) x ((((Garage - 900) max 0) min 0.01) x 100))
i.e.:
Garage - Volvo_Charge
Ideas?
Let me know if anyone has ideas on how to further improve this method! It’s working pretty well at the moment but is obviously a bit fragile and dependent on specific values for my specific circuit and EVSE.