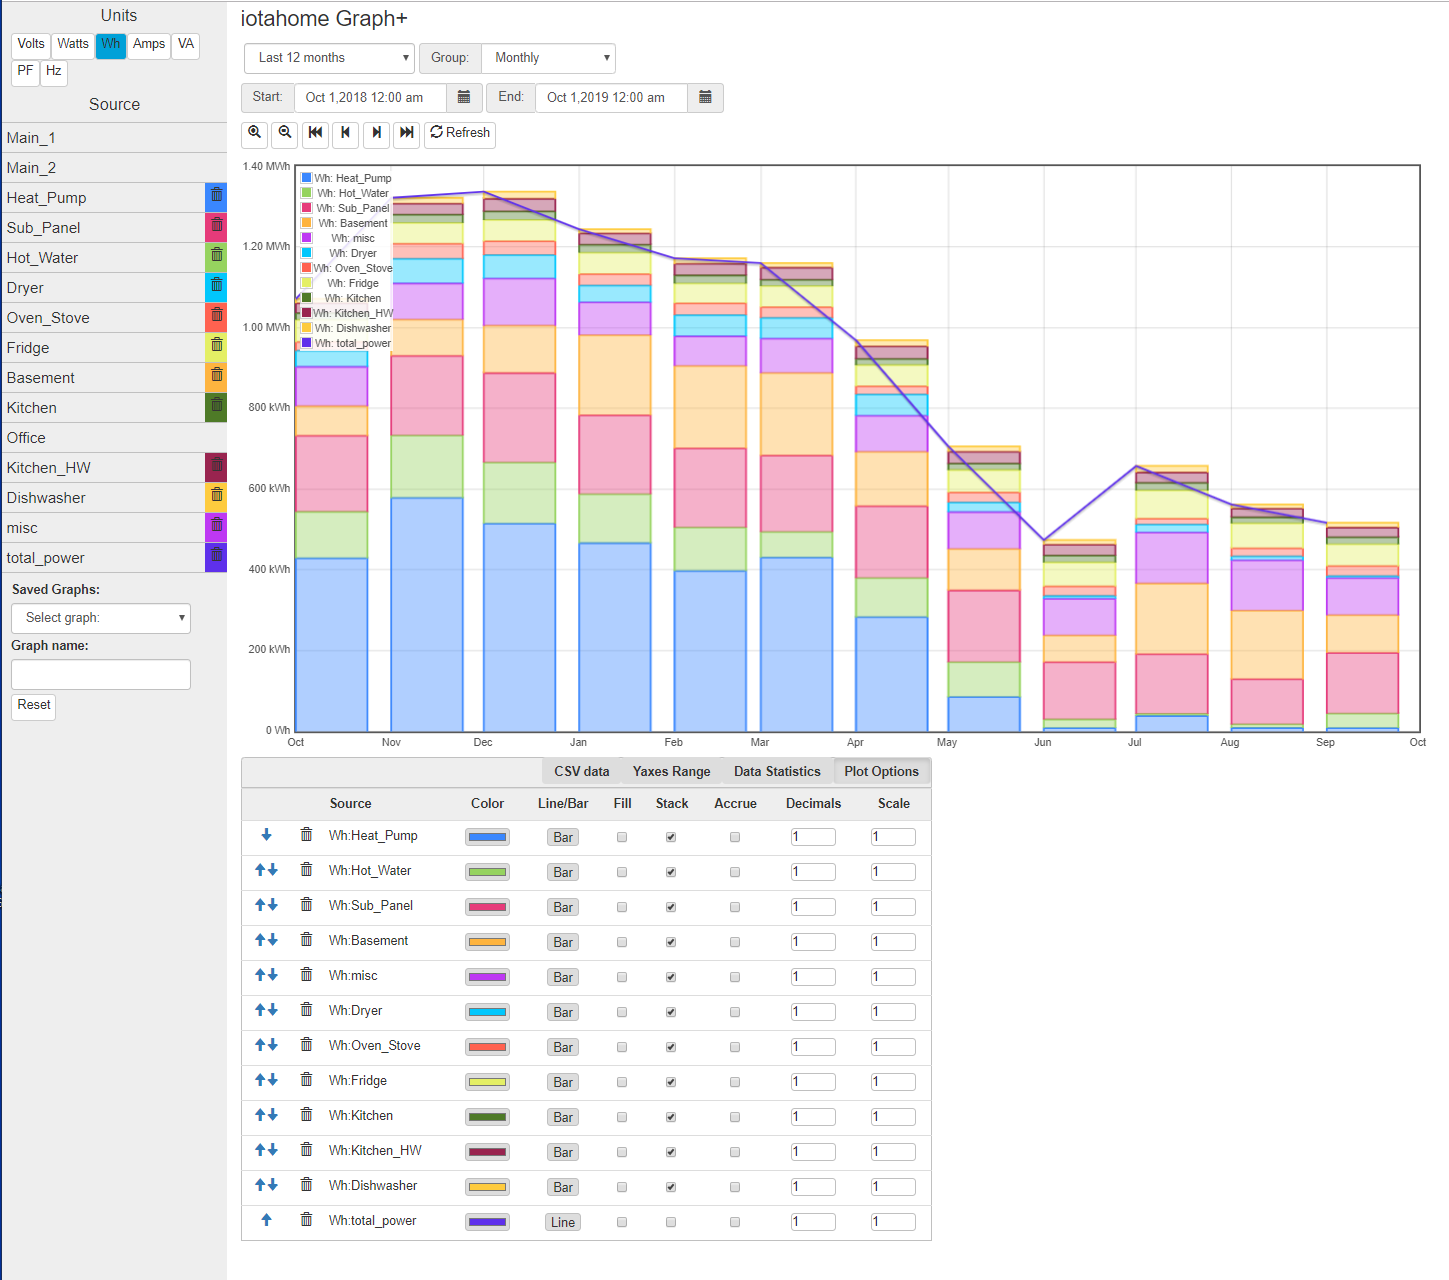
There has never been a stack option in the original IoTaWatt graph program. A completely reworked graph app called Graph+ Will be released in the next week or so, and has that capability as well as other new features and a completely different approach to data and time selection.
I don’t see the “delta” checkbox, I assume there is an equivalent?
A small UI detail would be a way to check “bar” or “stacked” or delta for all the inputs in the graph…
A more significant thing I have been missing in the iotawatt graph module compared to emonCMS is the ability to freely choose the interval (e.g. 10s) and fix it (e.g. in power diagrams short consistent power spikes become inconsistent as they get averaged over 3-4 samples).
This new Graph+ takes a different approach to most of these things.
Sort of. Rather than treat kW data as a cumulative series, Graph plus turns it around and reports the total kW for each group (interval). So what you understood to be delta data, is actually the default. If you want to accumulate across groups (not delta), then you use the accrue checkbox. I don’t know about you, but I have used delta much more often than not, this seems more natural. It also obviates the need for the so-called “reset-at-midnight” functions.
It’s all a matter of perspective. If you think about it, even the 5 second data points are averages of 300ms-500ms intervals. So where does it become “inconsistent”? ten seconds? twenty seconds? an hour? I maintain that’s highly subjective.
Graphing a time window of an hour or less will group at 5 seconds (interval). After that, you start to get larger groups. A day groups to 2 minutes. But if you request 10 second groups for a day, you get 8,640 data points. Notwithstanding the IoTaWatt issues with producing that several million byte response, the plot window doesn’t have the resolution to display it.
So the automatic grouping is the finest resolution that can be represented on the graph, which is about 720 data points.
Not in the plan, but… Graph+ is completely asynchronous and event driven, so you don’t need to wait before checking another box.
Hmmm, do you mean that the data actually stored in the time series is not cumulative anymore? In other terms, if I publish kWh data to emonCMS after upgrading to graph+, will emonCMS receive the same data as before?
And will I be able to restore and process old data on a graph+ unit; or exchange between graph+ and non graph+ unit?
If things remain compatible at the input/feed level I agree that deltas are more useful than the ever increasing index…
Good points, I see what you mean. Still I often run into the case where I’d like to see as much details as is available (even that itself is averaged); or where I want to use a specific grouping duration (1mn because beyond that the fridge or fuel pump periodic short spikes don’t display well). Having to chase it by adjusting the observation window is a bit of a pain.
I just realized (while exporting to InfluxDB) that the device never cumulative energy, and that I had always been using emonCMS to convert power to energy.
So yes, I completely agree that storing and dealing with energy-by-interval chunks is easier and more natural (and probably more accurate) than an ever increasing index.