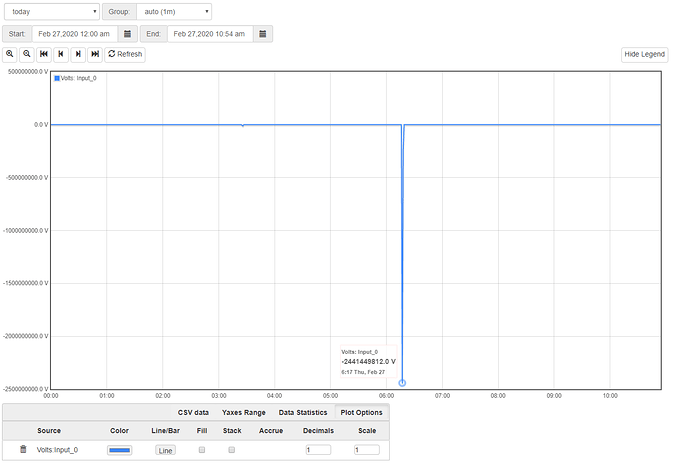
Strange rogue voltage reading - momentary but sending my logs bananas!

Hi folks,

I have seen a number of negative spikes on my Input0 voltage reference channel (2 occurences for a single reading over the past 2 weeks. the number is an order of magnatude higher than I would have thought i would see for an intermittent OC fault so I wonder if anyone has seen similar before?

The unit is in derived 3 phase mode so i wonder if there was a phase lost in a fault if it might creat something like this?

Any help appreciated

J

First, what version are you on? Since you know when this occurred from the graph, can you post the log from that time.

In terms of dealing with the corrupted datalog, if you beats an output defined as
Input_0 max 100
And plot that instead of the raw input, you should get a better result.

I’d like to figure out what happened here.

Thanks for the response

IoTaWatt 4.x, Firmware version 02_05_02

logs either side of the event:

2/21/20 22:42:55z Real Time Clock is running. Unix time 1582324975
2/21/20 22:42:55z Reset reason: Software/System restart
2/21/20 22:42:56z Trace: 1:3, 1:4, 1:5[7], 7:0, 7:9, 1:6, 1:1[1], 1:2[2], 9:0[2], 9:0, 9:1, 8:4, 8:6, 8:8, 8:9, 9:3, 9:5, 9:9, 1:2, 1:3, 1:4, 1:5[7], 7:0, 7:9, 1:6, 1:3, 1:4, 1:5[21], 21:0, 21:1, 21:10, 21:10
2/21/20 22:42:57z ESP8266 ChipID: 2518062
2/21/20 22:42:58z IoTaWatt 4.x, Firmware version 02_05_02
2/21/20 22:42:58z SPIFFS mounted.
2/21/20 22:43:00z Local time zone: +0:00
2/21/20 22:43:00z device name: JohnFitz
2/21/20 22:43:00z MDNS responder started for hostname JohnFitz
2/21/20 22:43:01z LLMNR responder started for hostname JohnFitz
2/21/20 22:43:02z HTTP server started
2/21/20 22:43:02z WiFi connected. SSID=DCSIXBH24, IP=192.168.8.184, channel=11, RSSI -71db
2/21/20 22:43:03z timeSync: service started.
2/21/20 22:43:06z statService: started.
2/21/20 22:43:07z Updater: service started. Auto-update class is MAJOR
2/21/20 22:43:08z dataLog: service started.
2/21/20 22:43:29z dataLog: Last log entry 02/21/20 22:42:50
2/21/20 22:43:29z Updater: Auto-update is current for class MAJOR.
2/21/20 22:43:30z influxDB: started, url=192.168.2.187:8086, db=JohnFitzFrm, interval=10
2/21/20 22:44:09z historyLog: service started.
2/21/20 22:44:19z historyLog: Last log entry 02/21/20 22:42:00
2/21/20 22:46:53z influxDB: Start posting at 02/21/20 22:34:50
2/27/20 10:57:00z dataLog: datalog WDT - restarting

** Restart **

SD initialized.
2/27/20 10:57:02z Real Time Clock is running. Unix time 1582801022
2/27/20 10:57:02z Reset reason: Software/System restart
2/27/20 10:57:03z Trace: 25:41, 25:42, 25:41, 25:50, 25:51, 25:53, 25:54, 25:60, 25:61, 25:61, 25:63, 25:55, 25:56, 25:41, 25:42, 25:41, 25:50, 25:51, 25:53, 25:54, 25:60, 25:61, 25:61, 25:64, 25:65, 25:55, 25:56, 25:41, 25:42, 25:41, 25:50, 25:51
2/27/20 10:57:05z ESP8266 ChipID: 2518062
2/27/20 10:57:05z IoTaWatt 4.x, Firmware version 02_05_02
2/27/20 10:57:05z SPIFFS mounted.
2/27/20 10:57:07z Local time zone: +0:00
2/27/20 10:57:07z device name: JohnFitz
2/27/20 10:57:08z MDNS responder started for hostname JohnFitz
2/27/20 10:57:09z LLMNR responder started for hostname JohnFitz
2/27/20 10:57:09z HTTP server started
2/27/20 10:57:10z WiFi connected. SSID=DCSIXBH24, IP=192.168.8.184, channel=11, RSSI -75db
2/27/20 10:57:11z timeSync: service started.
2/27/20 10:57:11z statService: started.
2/27/20 10:57:11z Updater: service started. Auto-update class is MAJOR
2/27/20 10:57:12z dataLog: service started.
2/27/20 10:57:31z dataLog: Last log entry 02/27/20 10:56:30
2/27/20 10:57:32z Updater: Auto-update is current for class MAJOR.
2/27/20 10:57:33z influxDB: started, url=xxxx, db=xxxx, interval=10
2/27/20 10:57:45z influxDB: Start posting at 02/27/20 10:56:30
2/27/20 10:58:12z historyLog: service started.
2/27/20 10:58:22z historyLog: Last log entry 02/27/20 10:56:00
2/27/20 11:08:15z dataLog: datalog WDT - restarting

thanks
Those datalog WDT resets are troubling. That is a watchdog timer that goes off if the datalog is not updated for 30 seconds. It is not normal for this to go off.

Your system was in the middle of responding to a query when that happened. Can you tell me if that query was from Graph+ or something else that you generated?

To be clear, this wdt may be a symptom of a datalog problem or it may have been the cause (the duration of the response, not the query itself).

I suspect it was during a delay when using Graph+ as both coincide

the fact that the voltage is minus, is that indicative of something to do with calculations on the derived 3 phase?

I don’t believe this has anything to do with derived three-phase.

What info would be helpful to troubleshoot further?

Just to be clear on this, are you saying that the restart coincides with a pause using Graph+ or that the negative spike coincides? I know the former is what I asked, but just making sure. Also, were you interacting with the IoTaWatt around the time of the negative spike.

Id like to see a graph of that voltage channel using the “original graph” program choice under the Data tab. It starts setup to graph the current day, which I believe it still is there. Using the “energy” tab on the left, select Input_0 and post the resulting plot. Select “Show CSV Output” at the bottom and then Time Format: Date-time-string. Locate the cluster of entries around 6:17 and post about 20 entries with that centered. That will tell me a lot about what’s going on in the datalog.


I have only seen this once before, and it was recently with an ESP32 version of IoTaWatt here on my bench. That version has a completely different way of doing sampling, but it does maintain the datalogs in essentially the same way. What I suspect is the problem there has to do with the ESP32 millisecond clock being subject to regressing due to reset of the system clock from SNTP. That’s not how the ESP8266 works, so I’m curious if these are related and I may be barking up the wrong tree with the ESP32. A more in depth look at the datalog would be helpful, but there are no tools in place to do that. I may add some API to do that.

The only way to remove these anomalies is delete the logs. I don’t know if that’s something you would contemplate. If it is, I could use a copy of the /iotawatt/iotalog.log file. The only reliable way to capture that is to remove the SDcard and copy on another computer.

Thanks Bob,

I will attempt to get this completed before the end of the week as work has gone mad with Covid!

we have done quite a lot with NTP of late which may correlate with this.

Thanks again for your help. and I will be back ASAP

Jon

Bingo. That’s actually promising because the solution used in the ESP32 version (which appears to be working), can be used in the ESP8266 version. In fact, I have already merged it into the staging branch for the next release.

Hoping to do some testing but we have locked down all remote devices as if we bump them and they dont come back during covid it wont end with happy customers. I will get back ASAP bob.

Thanks

1 Like