Total energy consumption fluctuation

Hi there,

First off, thank you very much for this awesome project. I am a happy user of IoTAWatt since 2019 :sunglasses:

Today I realized that my readings in an external system were inaccurate. I use the Query API to get total power consumption in Wh since I installed IoTAWatt:
http://iotawatt.mydomain/query?select=[time.iso,total_power.wh.d6]&begin=2019-01-01&end=m&group=all

However, the query returns values not monotonically increasing, but fluctuating quite a bit:

(this is plotted from values stored in the external system. The system queries the API every 10 minutes).

I realized that when using the current year, values do increase monotonically.

What is going on here? Is getting total energy consumption over more than one year problematic for some reason?

Is using the Query API a proper way to get the total meter value or is there a different method?

Firmware version: 02_06_02

Best regards,
Stefan

Do you have solar or another form of generation that can drive total_power negative? Can you post your outputs display? Can you plot Wh fortotal_power using Graph+ with the accrue option?

No form of generation.

My output screen

From what I can tell, the data stored in IoTAWatt is correct. Everything I plot in Graph+ seems correct too.

It really seems to be related to the date + the fact that I use group=all. It is easily reproducible. Using begin=y (or this years start date) does not show the problem.

$ while [ true ]
do
    date
    curl -w "\n" 'http://iotawatt.lan/query?select=\[time.iso,total_power.wh.d6\]&begin=2019-01-01&end=m&group=all'
    curl -w "\n" 'http://iotawatt.lan/query?select=\[time.iso,total_power.wh.d6\]&begin=y&end=m&group=all' 
    sleep 5
done
Fr 30 Jul 2021 14:10:53 CEST
[["2019-01-01T00:00:00",3872705.015]]
[["2021-01-01T00:00:00",2282274.043]]
Fr 30 Jul 2021 14:10:58 CEST
[["2019-01-01T00:00:00",3872704.732]]
[["2021-01-01T00:00:00",2282274.043]]
Fr 30 Jul 2021 14:11:04 CEST
[["2019-01-01T00:00:00",3872710.074]]
[["2021-01-01T00:00:00",2282279.668]]
Fr 30 Jul 2021 14:11:09 CEST
[["2019-01-01T00:00:00",3872709.504]]
[["2021-01-01T00:00:00",2282279.668]]
Fr 30 Jul 2021 14:11:15 CEST
[["2019-01-01T00:00:00",3872709.216]]
[["2021-01-01T00:00:00",2282279.668]]
Fr 30 Jul 2021 14:11:20 CEST
[["2019-01-01T00:00:00",3872708.928]]
[["2021-01-01T00:00:00",2282279.668]]
Fr 30 Jul 2021 14:11:26 CEST
[["2019-01-01T00:00:00",3872708.644]]
[["2021-01-01T00:00:00",2282279.668]]
Fr 30 Jul 2021 14:11:31 CEST
[["2019-01-01T00:00:00",3872708.361]]
[["2021-01-01T00:00:00",2282279.668]]
Fr 30 Jul 2021 14:11:37 CEST
[["2019-01-01T00:00:00",3872708.075]]
[["2021-01-01T00:00:00",2282279.668]]
Fr 30 Jul 2021 14:11:42 CEST
[["2019-01-01T00:00:00",3872707.791]]
[["2021-01-01T00:00:00",2282279.668]]
Fr 30 Jul 2021 14:11:47 CEST
[["2019-01-01T00:00:00",3872707.505]]
[["2021-01-01T00:00:00",2282279.668]]

The values of the first curl are fluctuating. The second curl returns monotonically increasing values as expected.

Best regards,
Stefan

I can’t reproduce that with my home system. I submit the query:
http://iotahome.local/query?select=[time.iso,total_power.wh.d6]&begin=2019-01-01&end=m&group=all&group=all
Every few seconds and get the same response, but changing every minute as to be expected.

So there’s more to this than meets the eye. I’ll try and dig deeper when I get time over the weekend. In the meantime, would you repeat your experiment using each of the three phase inputs that contribute to total_power and post that. I’m curious to see if it’s an attribute of one of the values or all three. Also, could you repeat the total_power experiment adding T00:00:00 to the start time. All of that will be helpful.

Using the following query now:

curl -w "\n" 'http://iotawatt.lan/query?select=\[time.iso,Phase1.wh.d6,Phase2.wh.d6,Phase3.wh.d6,total_power.wh.d6\]&begin=2019-01-01T00:00:00&end=m&group=all'

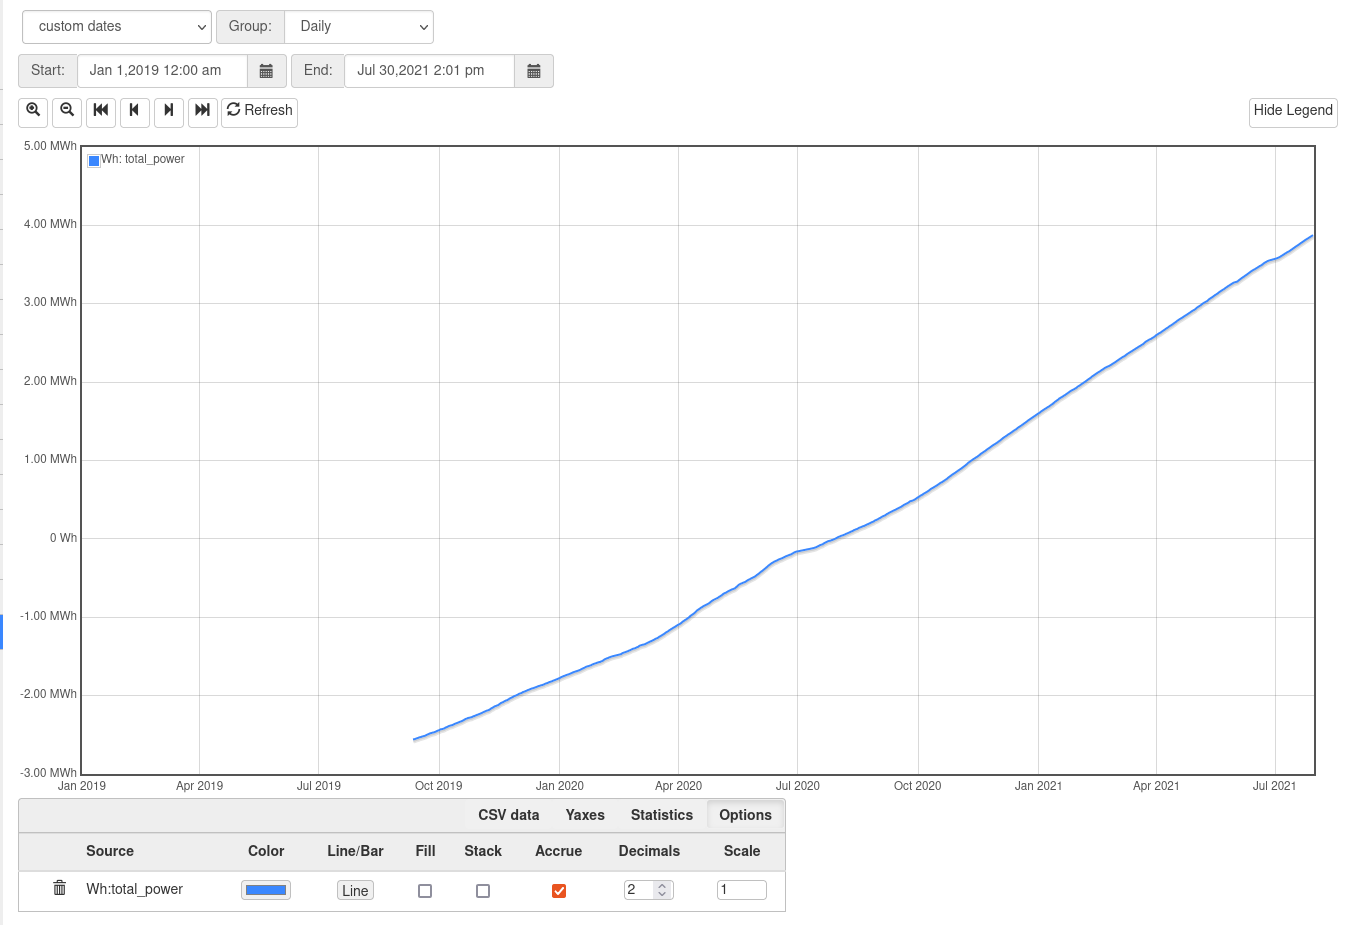
The behavior seems the same. Also, it seems that all phases are contributing a bit to the problem.

[["2019-01-01T00:00:00",2313692.317,603012.5413,956415.3693,3873120.228]]
Fr 30 Jul 2021 17:01:52 CEST
[["2019-01-01T00:00:00",2313692.317,603012.5413,956415.3693,3873120.228]]
Fr 30 Jul 2021 17:01:53 CEST
[["2019-01-01T00:00:00",2313692.317,603012.5413,956415.3693,3873120.228]]
Fr 30 Jul 2021 17:01:54 CEST
[["2019-01-01T00:00:00",2313692.107,603012.5003,956415.2596,3873119.867]]
Fr 30 Jul 2021 17:01:55 CEST
[["2019-01-01T00:00:00",2313692.107,603012.5003,956415.2596,3873119.867]]
Fr 30 Jul 2021 17:01:56 CEST
[["2019-01-01T00:00:00",2313692.107,603012.5003,956415.2596,3873119.867]]
Fr 30 Jul 2021 17:01:57 CEST
[["2019-01-01T00:00:00",2313692.107,603012.5003,956415.2596,3873119.867]]
Fr 30 Jul 2021 17:01:58 CEST
[["2019-01-01T00:00:00",2313696.93,603012.8963,956415.5257,3873125.352]]
Fr 30 Jul 2021 17:01:59 CEST
[["2019-01-01T00:00:00",2313696.93,603012.8963,956415.5257,3873125.352]]
Fr 30 Jul 2021 17:02:00 CEST
[["2019-01-01T00:00:00",2313696.93,603012.8963,956415.5257,3873125.352]]
Fr 30 Jul 2021 17:02:01 CEST
[["2019-01-01T00:00:00",2313696.93,603012.8963,956415.5257,3873125.352]]
Fr 30 Jul 2021 17:02:02 CEST
[["2019-01-01T00:00:00",2313696.93,603012.8963,956415.5257,3873125.352]]
Fr 30 Jul 2021 17:02:04 CEST
[["2019-01-01T00:00:00",2313696.721,603012.8551,956415.4163,3873124.992]]
Fr 30 Jul 2021 17:02:05 CEST
[["2019-01-01T00:00:00",2313696.721,603012.8551,956415.4163,3873124.992]]
Fr 30 Jul 2021 17:02:06 CEST

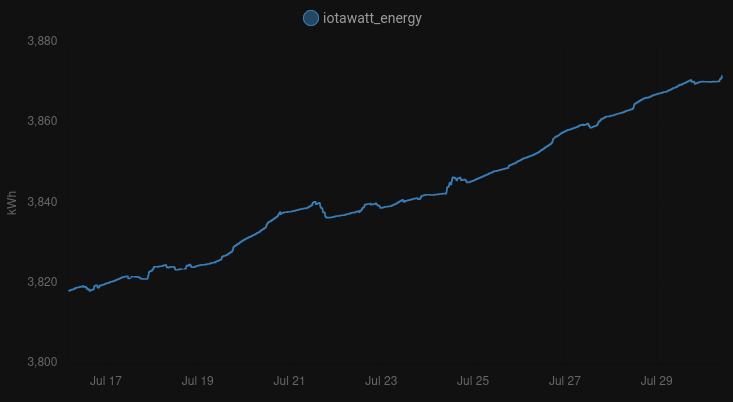
What I’ve noticed is that right at the minute boundary the value jumped back up. This is my PC’s clock, but its pretty much in sync with what IoTaWatt has.

Thanks for looking into it! Not urgent on my side, I am using begin=y currently, which seems to work. But probably still worth getting to the bottom of this.

Is using the Query API with begin=y an efficient method to get a energy consumption value? I can use pretty much any timescale, whatever is efficient for IoTaWatt.

It’s an intetresting problem that I’m pretty sure has a solution. I notice that the one second values only change every 5 seconds, which is the resolution of the current log, so that probably has something to do with it. I’ll take a look at the code in the next week.

This is a trivial query for IoTaWatt when group=all, regardless of the start date. Probably not a big deal, but using start=y will return zero for the minute while the ball is dropping in Times Square on New Years eve. If you only want a metric for the Wh used in the last minute, you might try start=m-1m&end=m

1 Like

I’ve managed to reproduce this and discovered what’s causing the values to decrease. As you discovered, the issue relates to the 2019-01-01 start date. I’m fairly confident that you don’t actually have data for that date, and that your history log begins after that. This is causing the query to use the wrong starting value from the current log which increases every 5 seconds.

This problem will occur anytime the starting date is less than the start date of your history log, regardless of whether you specify it as an absolute date (2019-01-01) or relatively (&start=y-2y).

What should happen is that the query should fail. I’ll make that change in an upcoming release, but in the meantime, you should avoid a starting date that is within the scope of your history log.

I’m fairly confident that you don’t actually have data for that date, and that your history log begins after that.

Indeed, that is true. I started using IoTaWatt sometime summer 2019.

This problem will occur anytime the starting date is less than the start date of your history log, regardless of whether you specify it as an absolute date (2019-01-01) or relatively (&start=y-2y).

Hm, so begin=y would be problematic the first year? And once your change is implemented, it would cause an error?

While I am flexible in the timespan I am looking to maximze the timespan somewhat to avoid accumulating errors: E.g. if I would poll every minute, and use begin=m, errors due to jitter of timer/network would accumulate over time. Since query API returns the start date, what would be good API is if I could just query since beginning (maybe begin=max?)

Actually no, because the current log will not wrap until after the first year.

Now you have me rethinking what to do about this.

I don’t think that is a problem if you use start=m-1m&end=m. There is no jitter with the datalog. if you query start=y&end=m a minute apart, the difference should be exactly the same as the difference between querying start=m-1m&end=m at the same times. Try it.

Where I see a problem is if you are accumulating the difference between this query and the last query as your total consumption. You need a consistent relative base. So perhaps it would be useful if anytime the requested begin is less than the first history log record, the first history log record is used.

I’ll let this sit awhile and see if anyone chimes in with another perspective. For now, begin=y should work for you.