InfluxDBv2 flux query allows totalization by calendar month. Does anyone have an example of this working?
I have a daily total working in FluxQL but I haven’t been able to get that to output the same thing in a Flux query.
FluxQL
SELECT integral(“value”) / 3600 / 1000 FROM “TotalPower” WHERE time >= now() - 7d and time <= now() GROUP BY time(1d) fill(null) tz(‘EST’)
V2 Flux Query
Returns zeros unless I comment out the map line. I can’t seem to make sense to the data or get it to match up with what the output directly from the iotawatt interface.
from(bucket: “iotawatt/autogen”)
|> range(start : 2023-01-01T00:00:00-00:00)
|> filter(fn: (r) => r._measurement == “TotalPower” and r._field == “value”)
|> aggregateWindow(every: 1d, fn: (column, tables=<-) => tables |> integral(unit: 1d), createEmpty: false)
|> map(fn: (r) => ({ r with _value: r._value / 3600.00 / 1000.0 }))
Which version of InfluxDB are you using?
With newer versions of 2.x you can still use IQL. I am using v2.6.1, which is currently the latest:
Releases · influxdata/influxdb (github.com)
That is what I am using unless I really need to use Flux.
I will also say that it seems like it is easier to do the integration of power to energy only when you need it (no need to learn about InfluxQL Continuous Queries | InfluxDB OSS 1.8 Documentation (influxdata.com) or the 2.0 flux replacement Migrate continuous queries to tasks | InfluxDB OSS 2.6 Documentation (influxdata.com)
The problem with doing the integration only when you need it, is that it takes too long and you will likely get timeouts.
Your examples don’t show Grafana stuff. There are also tricks/details you have to get right to use with the time/range selector in Grafana.
So, to get monthly data you REALLY need to figure out Tasks in InfluxDB and generate the data that way. I haven’t done that yet. I need to get my data over to the new database/machine, but it hasn’t been very high on the priority list.
InfluxDB Current version: 4.5.0
GrafanaCurrent version: 8.1.0
fluxQL doesnt have by calendar month that’s why I’m looking for a flux query.
I don’t have any timeout everythng works fine so far.
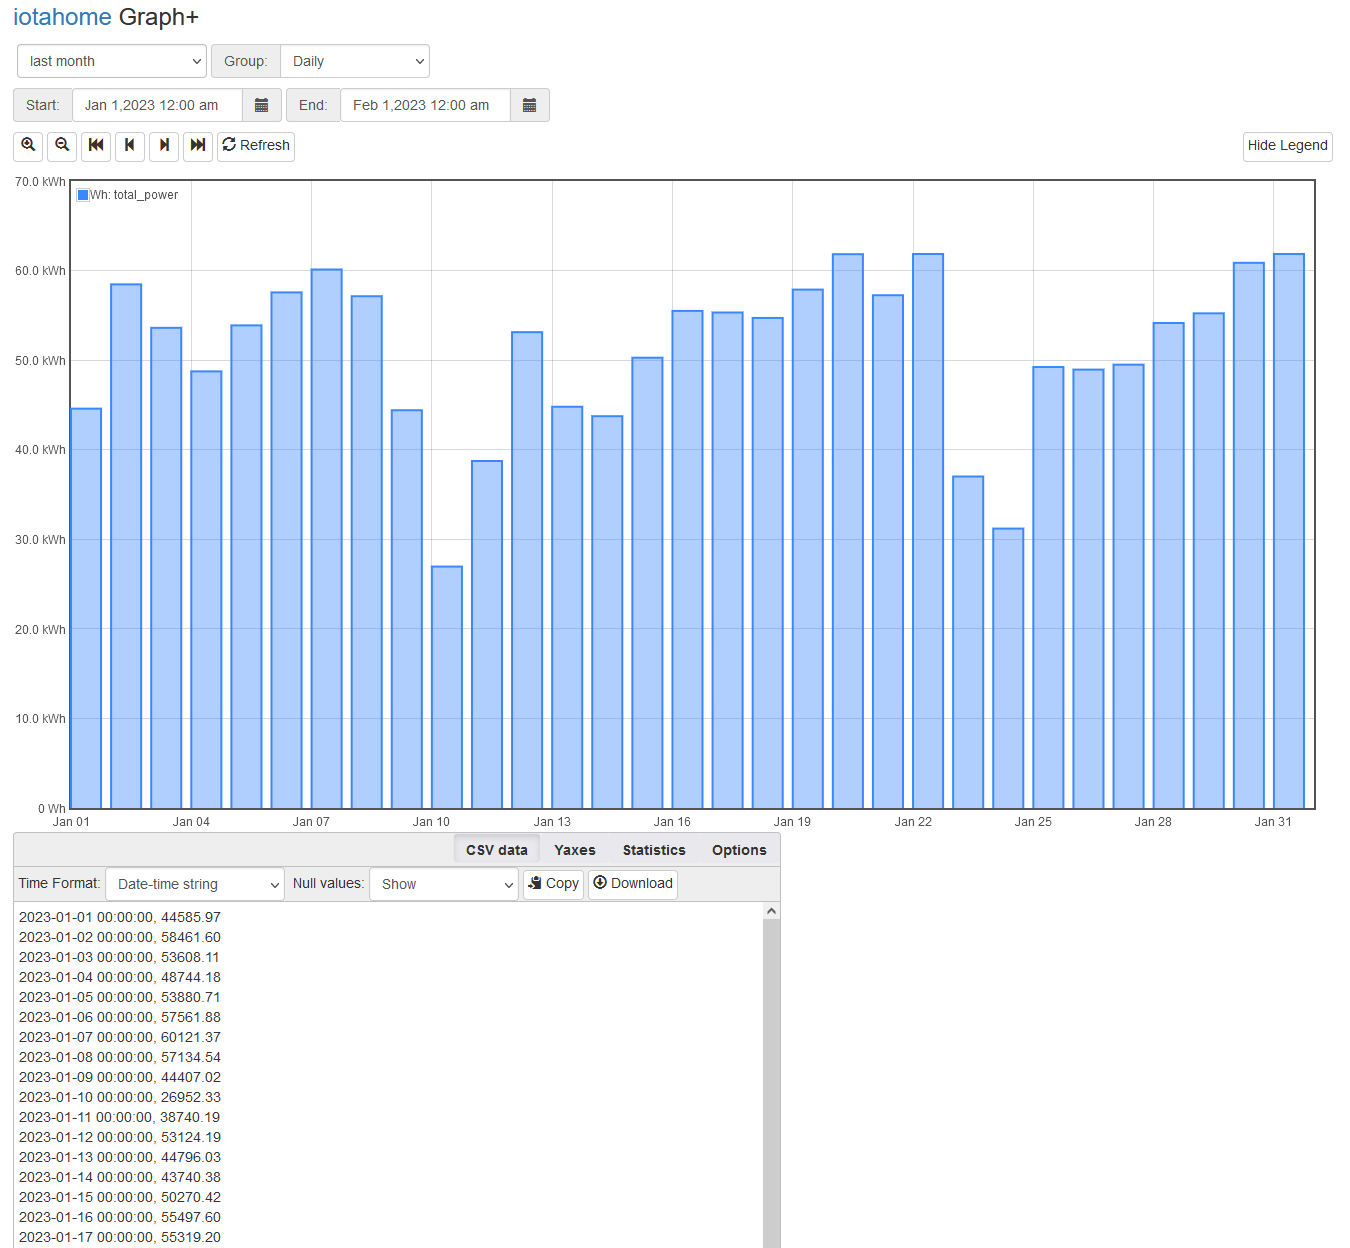
Here is my grafana daily total setup
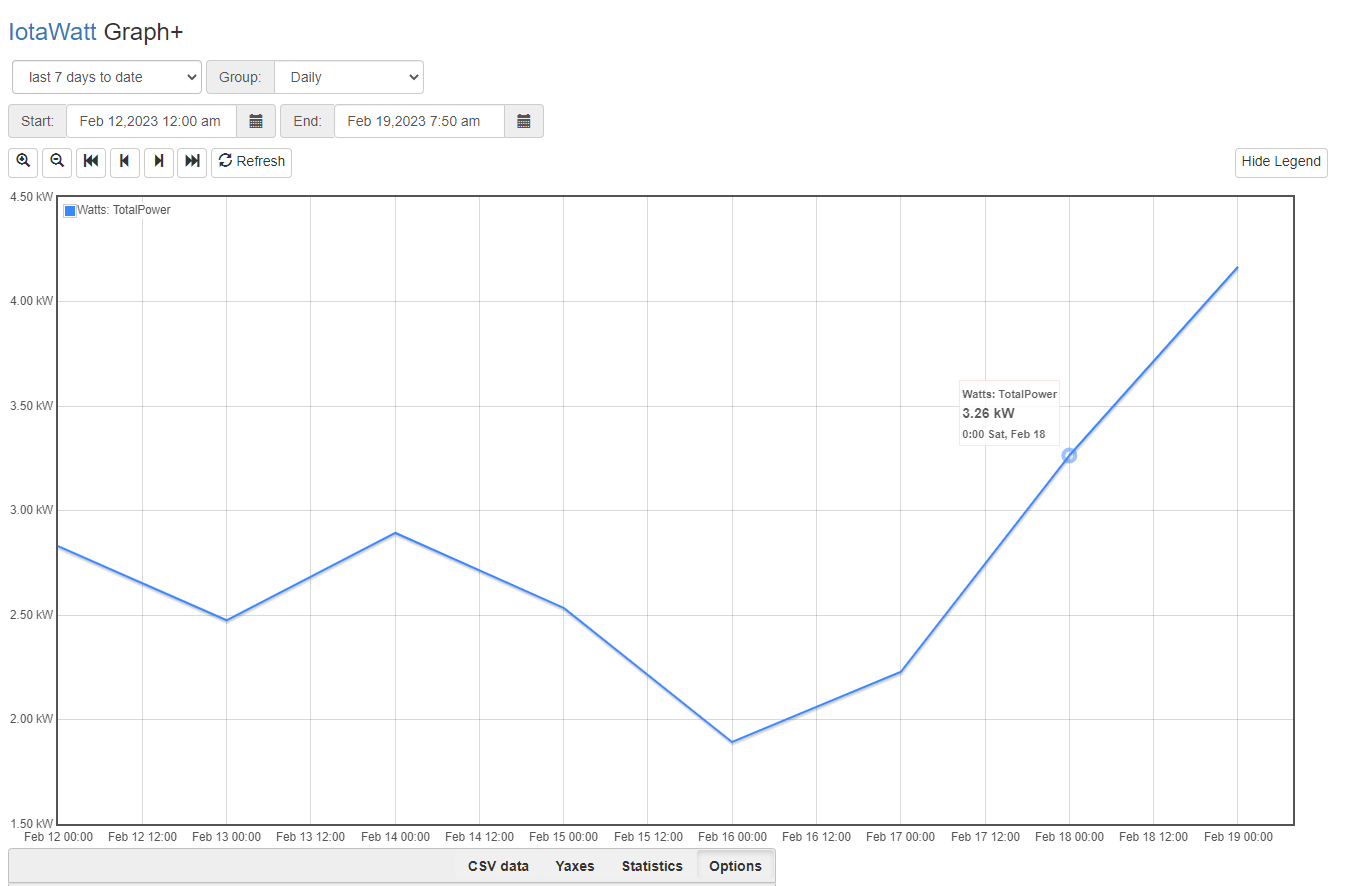
I also noticed I can’t seem to get the correct daily total through iotawatt.
You are plotting kWh with Grafana but Watts with The IoTaWatt. What you are getting is the average daily Watts. They are consistent. For example, on the 13th Grafana shown just shy of 60 kWh. IoTaWatt shows an average of about 2.5 kW for the day. 2.5 kW over 24 hours would be 60 kWh.
If you select Wh units in Graph+, you will get the same kWh as Grafana.
Ahh okay that makes sense thanks.
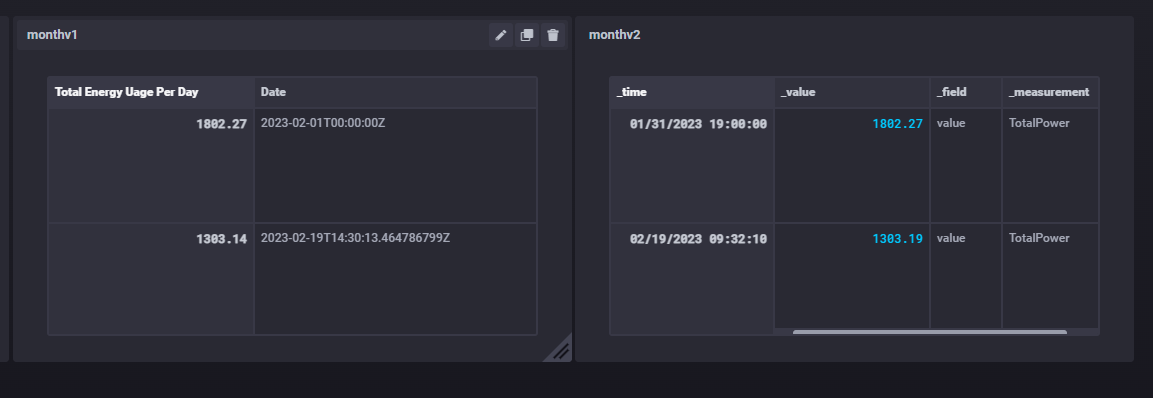
Still haven’t quite got the flux query to totalize month correctly. Both of these return the same value but seem to be about half of what my actual kWh is.
Monthv1
from(bucket: “iotawatt/autogen”)
|> range(start: v.timeRangeStart)
|> filter(fn: (r) => r._measurement == “TotalPower” and r._field == “value”)
|> filter(fn: (r) => r._field == “value”)
|> aggregateWindow(every: 1mo, fn: (column, tables=<-) =>
tables |> integral(), createEmpty: false)
|> map(fn: (r) => ({ r with _value: r._value / 3600.0 / 1000.0 }))
|> keep(columns: [“_time”, “_value”])
|> sort(columns: [“_time”])
Monthv2
from(bucket: “iotawatt/autogen”)
|> range(start: v.timeRangeStart)
|> filter(fn: (r) => r._measurement == “TotalPower” and r._field == “value”)
|> aggregateWindow(
every: 1mo,
fn: (tables=<-, column) =>
tables
|> integral(unit: 1h)
|> map(fn: (r) => ({ r with _value: r._value / 1000.0})))
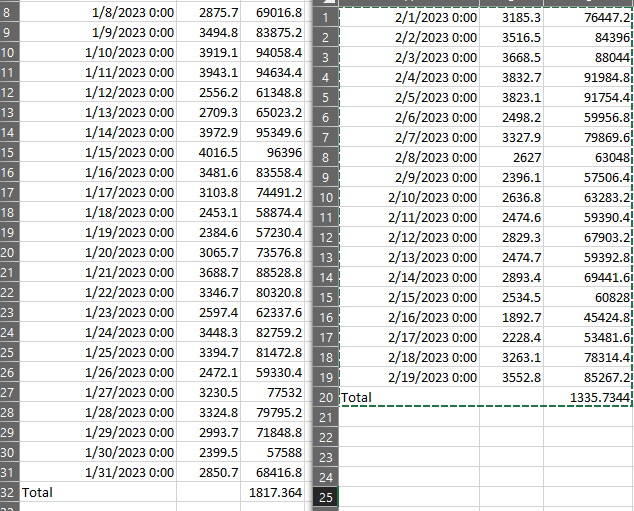
Actually using that daily value * 24 gave me the data I needed to compare my monthly totals. Which appear to be correct with my calculations. Guess I’ll wait for this months power bill and compare to a full month’s kWh recoding.
.
Might be easier to ask for Wh, get a CSV table and click download to make a spreadsheet.
That’s what I did above.
I looked closer at my bill the dates increment 31 days not by calendar month i.e. 1/20 to 2/21. It’s pretty close on my most recent bill I read 2052 kWh and my bill shows 2252 kWh.
Here’s the query I used to determine that.
from(bucket: “iotawatt/autogen”)
|> range(start : 2023-01-20T00:00:00-00:00)
|> filter(fn: (r) => r._measurement == “TotalPower” and r._field == “value”)
|> aggregateWindow(
every: 31d,
fn: (tables=<-, column) =>
tables
|> integral(unit: 1h)
|> map(fn: (r) => ({ r with _value: r._value / 1000.0})))
Sorry to resurrect an old thread, but I’m trying to do something similar with flux and not having any luck. When I adapt your query with my inputs, I get the error: “Bar Charts require a string or time field”