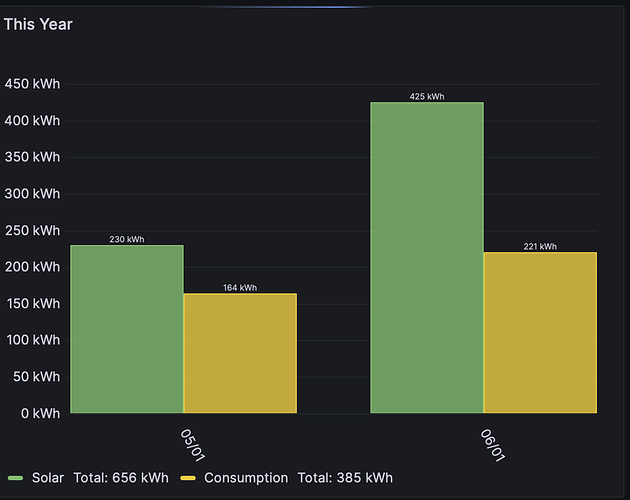
In the process of starting over with influxdb using V2, and having some trouble with monthly bar graphs. I’m feeding in watt data, and need to sort the data into days, and also convert from watts to KWH. I’m able to generate the graph with the following query, but this doesn’t do the last conversion to KWH. How do I format in the integral calculation?
from(bucket: “iotabucket”)
|> range(start: v.timeRangeStart, stop:v.timeRangeStop)
|> filter(fn: (r) => r[“_measurement”] == “iotawatt”)
|> filter(fn: (r) => r[“sensor”] == “Solar”)
|> filter(fn: (r) => r[“_field”] == “Watts”)
|> aggregateWindow(every: 1d, fn: sum, createEmpty: false, timeSrc: “_start”)
