Hi,
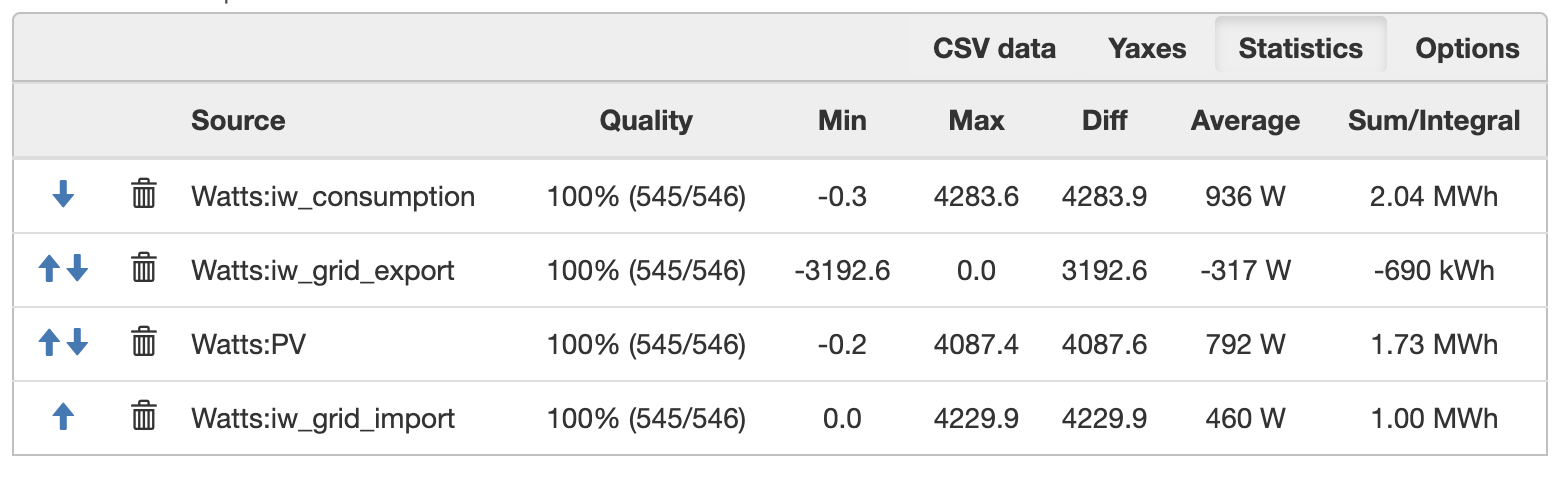
I am using the Graph+ module to display grid import and pv export statistics over a 3 month period. In this time the import kWh is over 999kWh so is shown a MWh, in my case 1.00MWH.
Is it possible to display the Sum/Integral as either kWh or an MWH with more decimal places eg 1.0999MWH?
Or is there a method to show this data in a different area?
Thanks.
Plot it using Wh units and set group = ALL, then click on CSV at the bottom to see the total Wh. Divide by 1000 for kWh.
Perfect. Worked a treat. Getting results within about 1-1.5% of utility meter which I am quite happy with. If I wanted to correct this what would be the best/easiest way? Using SCT013-000 clamps.
Thanks overeasy.
1.5% is pretty acceptable for an energy “monitor” as opposed to an electric “meter”. It’s not a revenue device and isn’t tested to that standard. Expecting to “correct” the IoTaWatt to agree perfectly with the meter is not realistic. Even the meter is only typically only certified to 0.5%, your SCT013-000 is advertised as 1%, and the begin and end times for the IoTaWatt reading vs the meter reading are probably not the same, although some newer smart meters do provide that data.