Now that I’ve got both of my IotaWatts running, I’m trying to figure out how to combine data from both of them.
My original is in my main panel. The new one is in a subpanel in the garage recording solar.
I’m wishing there was a way to combine outputs from each unit for data logging purposes.
Also for PVoutput. I’m uploading generation data from the solar connected IotaWatt but would be nice to upload consumption as well, but that’s on the other unit.
I know, wishful thinking to do on the Iota itself. But any thoughts of how to accomplish what I’m thinking?
Me too. I recognize another Hubitat user when I see one.
I struggle with displaying what I want in Grafana though.
But I’d really like to upload my consumption data to pvoutout, but not sure how happy the service would be getting data from two separate uploads.
Back to grafana, I’ve got my generation on one set of graphs, and consumption on another. Main feed from the power company seems to be working well with allow negative checked.
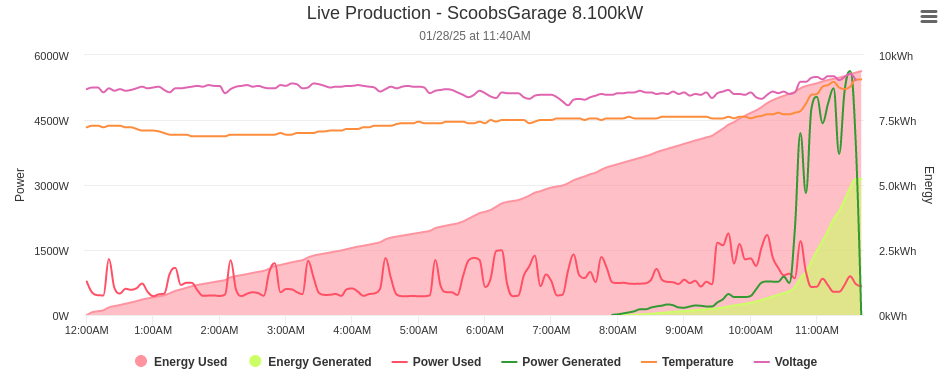
4 inches of snow on my panels, but I got to see a little bit feeding back to the grid today while nobody was home.
So I just tried uploading consumption only from my first IotaWatt to pvoutput. Seems to be working getting consumption and generation from the two devices.
Obviously my consumption goes negative when I’m generating more than I’m using. But does anyone know if pvoutput is happy with that? Seems this morning when it went negative, the consumption line disappeared.
And if that’s the case, is there a transform or formula I can use in Iotawatt to report that as 0?
I posted over on their forum too, but doesn’t seem as active as over here.
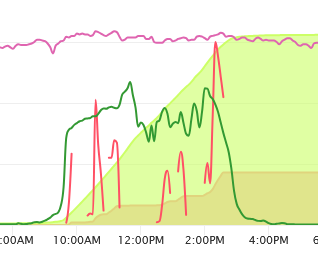
That’s how it works. You are not consuming anything. I looked at some other sites and same thing, the power used doesn’t seem to show up when it’s zero, and that can happen abruptly with 5 minute intervals. Like this:
Not a big deal really, if it isn’t there, it’s zero. The Energy used plot will be flat-lined during those periods.Pretty good production for a cold winter day.
It just throws off the energy export numbers looking at the last graph. It sees what I’m generating, and what I pull from the grid, but it thinks anything I generate while main clamps are negative is being exported.
But I don’t think it’s going to be possible track energy I use from solar while generating the way I’m installed. The only way I could see to get seperate readings would be if the solar were line side tapped. Set of CT’s on the solar, and a set of CT’s on my main breaker.
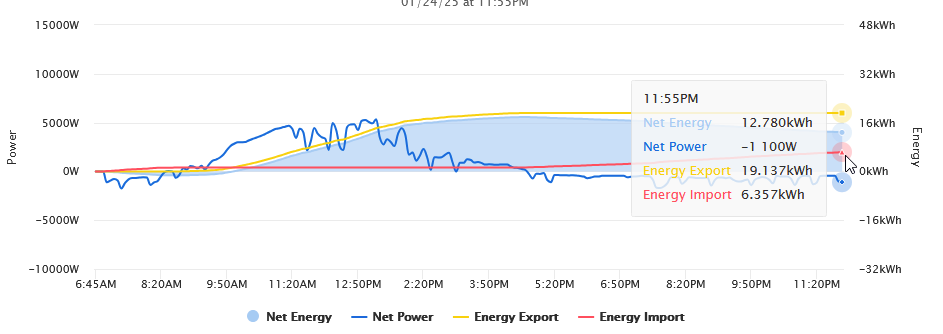
I can get a pretty accurate export value from my influx/grafana setup. Just don’t think it’s going to be possible in pvoutput. Unless I’m not understanding something
[EDIT] Now that I’ve had my morning coffee, I got to thinking. Wouldn’t MAIN - SOLAR = be an accurate representation of the net product? Even if it is, I don’t see how since I’m feeding from two seperate units and can’t do that math.
I made a homebrew solution. Solar generation, and consumption are recorded to influxdb. Since my consumption goes negative when I’m feeding to the grid it throws off the net energy value.
My work around is a script that queries influxdb every 5 minutes for both values, and subracts generation from consumption, and uses curl to send the result to pvoutput… The result is the power the house is actually consuming.