Unit down: green light, no sending, no webserver - resolved

Hi Bob! Thanks for your great unit.

I’ve been successfully monitoring a 3 phase installation in Australia you previous assisted with. All good for about 12 months. On 6th Sept 2018, 6am (local), the unit stopped sending data to emoncms. It was flashing three green. No problems with my other iotawatt units.

I restarted (ie. power cycled) and got a steady green, and could see it on Wifi. However, its webserver was inaccessible and no data was sent to emoncms. I turned off the WiFi router and could access it via the AP. Tried again on Wifi and then a different Wifi but no luck - still no sending of data or webserver accessibility.

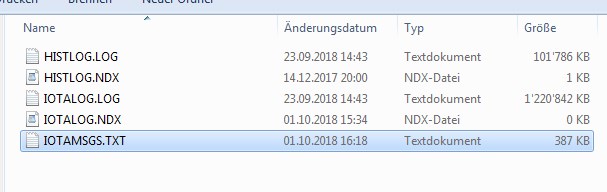
I removed the SD card and have attached the logs. You’ll see a software watchdog reset (9/05/18 21:27) and then my power cycling tests. I’ve attached my config file too. Nothing changed externally at the fail time and the SD card appears ok (since I could read the logs).

I haven’t tried a reset via the AP webserver interface. I’ve been unable to find this problem on the forum.

Can you assist? Thanks again.

Details:
IOTAMSGS and CONFIG.TXT (405.2 KB) combined as I can’t post 2 files.

Dashboard (broken as no logging): https://emoncms.org/dashboard/view&id=46548
Chip ID 1848778 Flash Chip ID 1458376
IDE Flash Size 4194304 bytes Real Flash Size 4194304 bytes
Soft AP IP 192.168.4.1
Soft AP MAC A2:20:A6:1C:35:CA
Station MAC A0:20:A6:1C:35:CA

This problem just cropped up yesterday. There was another similar failure, and my own home system did the same thing. It is related to the datalog. The current datalog (the 5second resolution log) gets very large, and after about a year will stop growing and wrap around to replace old entries with new entries. I think there is a problem with that wrap. My system had wrapped 6 months ago, and I had run multiple systems with smaller current logs that wrapped multiple times, so I had high confidence in that. I’m rethinking that now.

If it’s what I think it is, and I’ll know more in a day or so, it should only affect users with systems that have been running for a year or more.

I will start a blog thread as I work on it, and hopefully confirm it is the problem, and come up with an action plan. Best case would be the current log is not actually damaged, and I can just rework the wrap logic to fix a boundary problem. Worst case is that the current logs are gone.

If you want to wait a day or two while I do this, your IoTaWatt will not be logging during that time, but you may be able to recover your current log.

The other solution is to delete the current log. IoTaWatt will restart and create a new one. The history log should be OK, and will provide local graphing to 1 minute resolution (standard graphing only requires 2 minute resolution).

If you want to delete the current log, you can do so with the request:

http://iotawatt.local/command?deletelog=current

You system will restart, and should be more or less back to normal. Please advise what you decide and if you delete the log, if that solves your problem.

Sorry for the failure, I plan to make this more robust and at least self-recovering.

Bob

I’ve posted a blog entry about this issue.

Short: I deleted the log and it worked. Great!

Long: I tried to delete the log via the AP mode webserver, but this mode apparently doesn’t process commands (/command not found). Instead connect to WiFi router and tried:

http://iotawatt.local/command?deletelog=current

but this request timed out (ping works and port 80 is open, just no response). Checked github I saw this command deletes IotaLog.log and IotaLog.ndx. I removed the SD card and manually deleted these. Restarting the device it appears to work as expected, although I’m yet to re-install on site.

For your interest, the IotaLog file was 1.1Gb. The “Data Logs” section now says “Current Log from 9/10/2018 12:25pm to 12:33pm” (matches deletion/restart time) and the history log is “12/8/2017 2:44pm to 9/6/2018 1:45pm”.

Losing the fine grained log is not a problem. Thanks for your assistance.

Glad to hear it. Thanks for the follow-up. When you said you had been going for about 12 months, I associated that with the wrap problem. I see now that your logs date back to December 2017, so not a wrap system and probably not one of the two problems that I found on my system. Nevertheless, the changes this and others precipitated will produce a small diagnostic file that will help find and fix future occurrences of datalog problems.

It doesn’t, but I don’t understand why you were in AP mode.

I meant to mention that I see by your configuration that you are doing derived reference three-phase by manipulating the phase shift of the CTs. I would encourage you to look into using the derived reference support that has been added since then. I think you will find that it’s easy to use and uncouples the CT characteristics from the three-phase requirements. I think it would take about five minutes to change over your config.

No worries. I’ve re-installed on site and run into some further issues. Warning: hard-to-diagnose problems ahead!

After 24hrs turned off, I reconnected the CTs and Iotawatt to Wifi. I could see its webserver and the status power values looked good. However, EmonCms was not updating. I stopped and started this service, restarted, etc but could not get it to post. Couldn’t find any error msgs in the log. Status said “last updated emoncms <date/time of the day before>”. I issued the “delete log” command as discussed, got “ok” and it started posting. Good, but I’m a bit nervous about stability now - I’ll keep an eye on it.

More confusingly, 2 of 14 outputs are not being passed to EmonCMS. For example, output #4 is correctly reading (say) 1400W on the status tab, but it is sending 0.0 (not null/NaN) to emoncms. It happens on two outputs for no apparent reason. Nothing in the config (of emoncms or iotawatt) has changed. During my checking of the configuration on IotaWatt, I did get a “config out of date, restarting” error. I even tried changing the #4 reading to output to emoncms #16 as a debug. As expected, I saw this show as #16 on emoncms but it was still 0.0.

I understand it is probably impossible to replicate, but can you advise how to proceed? Perhaps I should reset everything (how?) and use the derived 3 phase. I’d prefer not to as I was happy with operation to date.

Thanks for your on-going assistance. I’ll definitely use the derived 3 phase in future - nice feature.

@brettbeeson,

Couple of things. Could you try to graph the inputs that are in question using the local graph app?

Could you post your config please?

The config file is unchanged from the above, but attached separately here:. config-no key.txt (3.8 KB)

I’d have to revisit site to get a look at the local graph. This possible, but time-consuming. Any other ideas while I’m there?

I haven’t seen this issue before. The power displayed in the status screen comes from a different place than what is uploaded. The uploaded data comes from the datalog. My best guess is that the accumulators for those two channels have somehow become NaN. When you delete the current log, it is recreated using the last values in the history log if available. If there is no history log, it will recreate with zeroes as in a new system.

The reason I wanted to see the graph is that it also comes from the datalog, and would confirm this. Since you don’t have easy access to the IoTaWatt, you will need to know how to fix it if those channels show up as zero in the graph. Both the history log and the current log will need to be deleted simultaneously.

So the deletelog commands cannot be used as currently implemented because you cannot do them simultaneously. You will need to remove the SDcard (with the power off) and delete both externally.

This should resolve all of the issues expressed above. A NaN in the datalogs can stop Emoncms.

There is a silver lining to this problem. First, the problem with NaN stopping Emoncms has been fixed in a soon to released version. But also, I’ll put in code to detect and fix a NaN when creating a new current log. Finally, I can modify the deletelog command to allow for simultaneously deleting both logs.

Please give me a shout out when you have deleted the logs and let me know if I got this right. Thanks again for your help. I’ll do my part and follow up on problems like this as long as folks report them.

UPDATE: I took a look at the release 02_02_30 that you are on, and there is code to stop NaN from being carried into a new current log from a history log. So I’m not sure what is going on at this point and deleting both logs may not be a solution.

I’d like to see a couple of local graphs of one of the faulty channels:

The first one would be of the channel selected under the “power” tab and zoomed in to 5 second intervals.

The second one would be of the same channel selected under the “energy” tab.

I have a theory about something that may have happened and those graphs may be the smoking gun I need.

Even if you decide to delete both logs, could you please try to capture that information beforehand?

I just attended site. The unit was still posting to EmonCMS but the cumulative values were off the scale (>10e100). Looking at a download from EmonCMS, I see the following for the cumulative kWh:

|11/09/2018 23:54|625.21|
|11/09/2018 23:55|inf|

But don’t see an erroneous value in the W feed which serves this cumulative feed. Half the cumulative feeds have this error. I figure I’m going to have try to fix this via EmonCMS (edit/delete/etc).

The IotaWatt webserver was not responding, so I couldn’t check the graphs. I decided to remove the unit and install a fresh unit. I used the Derived 3 Phase. Iotawatt crashed (i.e. stopped responding to web client request) twice. I powered down and up. Check logs - no indication of a fault. This occurred when checking the Status and Inputs repeatedly. This ended up ok and the unit is now posting. Also, the EmonCMS (under status) was greyed out even when working. Once I fix EmonCMS cumulative feeds, this site should be fixed.

Feedback on the Derived Three Phase: really nice and easy. My reference input was on Phase B and so I was a bit confused at first - I wanted to set Voltage as Phase B but couldn’t. I ended up working it out but trial and error.

I now have the old unit at home. I can connect to the AP and setup a WiFi. However, I can’t connect to the web server. I used SiLab USB-UART and a serial monitor to read serial at start (see below) which shows an error. I extracted the SD and put the config.txt and IOTAWATT folder here. Finally, I deleted the whole IOTAWATT folder and restarted it. The webserver now runs and I guess I can use it at another site. Maybe I should reformat the SD card?

Log from serial monitor:

** Restart **

SD initialized.
9/12/18 05:42:33z Real Time Clock is running. Unix time 1536730953
9/12/18 05:42:33z Version 02_03_13
9/12/18 05:42:33z Reset reason: External System
9/12/18 05:42:34z Trace: 1:5[5], 1:6, 1:1[4], 1:2[5], 9:0[5], 9:0, 9:1, 8:4, 8:6, 8:8, 9:2, 1:2, 1:3, 1:4, 1:5[19], 1:6, 1:1[5], 1:2[6], 9:0[6], 9:0, 9:1, 8:4, 8:6, 8:8, 9:2, 1:2, 1:3, 1:4, 1:5[14], 14:0, 14:1, 14:2
9/12/18 05:42:35z ESP8266 ChipID: 1848778
9/12/18 15:42:35 Local time zone: 10
9/12/18 15:42:36 device name: IotaWatt, version: 3
9/12/18 15:42:36 MDNS responder started
9/12/18 15:42:36 You can now connect to http://IotaWatt.local
9/12/18 15:42:37 HTTP server started
9/12/18 15:42:37 timeSync: service started.
9/12/18 15:42:38 statService: started.
9/12/18 15:42:38 WiFi connected. SSID NetComm 0405, IP 10.1.1.3, channel 11, RSSI -45db
Max samples exceeded.
9/12/18 15:42:39 Updater: service started. Auto-update class is MINOR
9/12/18 15:42:39 dataLog: service started.
9/12/18 15:42:39 dataLog: Last log entry 9/12/18 15:18:10
9/12/18 15:42:40 historyLog: service started.
Datalog inconsistent: size:
filesize:102428928
1512708240(0)-

There must have been one. Perhaps you have found an anomaly in Emoncms. Nevertheless, that explains the zero values in IoTaWatt.

The serial output shows that the datalog was bad, not a surprise with the history problem with Inf values. I haven’t seen anything to suggest any issues with the hardware, so yes, reformatting the SD would be a good way to insure a fresh start and leave these problems behind.

Good. Your results should be a little better as well. The phase naming can be confusing if you use ABC for the physical labels as well. That varies from place to place. I once joked that I should use Roman numerals, that’s actually starting to look like a good idea to avoid ambiguity.

Allowing the VT to be assigned to phase B makes explaining things more complicated. The fundamental concept that I use is that phase A is, by definition, the phase that the VT is plugged into. If you envision three phase as a circle where everything is relative, rather than a line that starts with A, it works.

1 Like

Ok, I’ll reformat the card.
Your explanation regarding 3 phase makes sense to me and I’d agree a non-A,B,C naming would be clearer.
I’ll try the troublesome IotaWatt on a non-remote site.

Thanks for your help and good luck with a great product.

[ I’m unsure what’s happening with EmonCMS, as when I plot the W feed it’s ok, but the kWh feed is broken/inf. ]

1 Like

Hi,

I’ve just experienced the same problem “Unit down: green light, no sending, no webserver”. You could ping the device but it appeared as if the webserver was down i.e. the browser would just hang.

The only solution was to open the device, take out the SD card and delete IotaLog.log and IotaLog.ndx.

My log file was 1,222,770 bytes long.

I started using the device in December 2017.

I’ve taken a full snapshot of everything on the SD card before deleting the log files. If I can provide any diagnostic information to help resolve this, don’t hesitate to let me know.

I’m back running now, so I’ve not got a problem but thought it might be useful to let you know.

Kind regards,

Tim

Hi Tim,

There have been a disturbing number of these datalog failures lately, and about the same vintage as you. Without getting into the nitty-gritty, I suspect there is some lingering damage from a problem that was fixed quite awhile ago, but I can’t be sure yet.

There is a newer release in ALPHA now that will produce diagnostics. If you are an ALPHA auto-update and your unit was on 02_03_14 at the time of the problem, there will be a diagnostic file /iotaWatt/logDiag.txt that is pretty small but would be hugely helpful.

If you were not on that release and you have the iotalog.log and histlog.log files, i’d like to get them and run that release against them to see both what the problem is and if the remedies that I put in can overcome it.

Thanks,
Bob

Hi Bob,

I’ve just checked and unfortunately there’s no logDiag.txt file, however I do have the iotalog.log and histlog.log files. What’s the best way to get them to you? Is there an email address I can send you a download link on? My internet connection isn’t great, so I might need to wait a couple of days to upload the files when I’m on a better connection, as iotalog.log is pretty big.

Regards,

Tim

When you get the link, could you PM it to me please?

Thanks

Hello,

I have exactly the same problem as described above. On September 23, IotaWatt stopped working. We were on vacation and I could not do anything. First I suspected and searched for a hardware or network error. Today I come across this article. I have removed the SD card. First I tried to copy all files as a backup. HISTLOG.LOG and IOTALOG.LOG are destroyed and unreadable. Enclosed a screenshot of the directory.
What should I do? Should I delete HISTLOG.LOG / NDX and IOTALOG.LOG / NDX? All four files seem to be broken. IOTAMSGS.TXT is readable and can be copied.
Many Thanks!

ScreenShot%20342%20F__IOTAWATT

Without more information, I can’t verify exactly what might have happened. I will say that it’s likely you have a corrupted current-log problem, and I say that because that is the only real show stopping problem that has been reported lately. You probably also have an older release of the software that has some vulnerabilities.

I don’t know how you determined that. The .NDX files are very simple files that are remnants of an old log system. They are maintained in older releases for backward compatibility only and have actually been removed entirely in the latest release. It is very unlikely that they are damaged unless there is damage to the SDcard, which is extremely rare.

Your history log appears to have about 9 months of history, so it may be worth trying to salvage that. I would recommend that you delete the IOTALOG.LOG file and try to restart your device. Since the above posts, i’ve recreated some of these issues and have discovered that there is a long recovery time in this instance because the history log must be formatted for the period from Sept 23 until now. There is an issue that causes that to take a long time, but if you want to try to salvage the history file, I’d recommend waiting at least a few hours aftyer restarting to see if it recovers.

Should that not work, deleting the four files should work to restart without history.

I’d be interested in seeing the end of this file from just before the failure to present, if you can post it.

The latest release will be going BETA then MINOR this week. It has some changes related to these problems and also produces a diagnostic file in the event of datalog corruption.

The message log that you sent shows several incidences of corruption beginning on or about Sept 26. The datalog was also apparently damaged at the same time. From then on, there was a long series of restarts due to problems trying to recover the data log. The message log has many incidences of damage, which is unexplained. I typically only see this kind of damage when the SDcard is removed or inserted while the IoTaWatt is powered. It is imperitive that the SDcard not be removed or inserted while the IoTaWatt has power.

To recover from this, I would recommend getting a new SDcard. Copy the files in the root directory of the old card to the new card, insert, power up. The new card should be formatted FAT32, which is typical of most new SDcards. You should not copy any subdirectories.

UPDATE: I forgot to mention that the message-log that was posted shows a terrible WiFi RSSI (Received Signal Strength Indicator). This is reinforced by the long history of communications problems in previous log entries. You can see the RSSI as part of the connect message in the log after each restart. It also indicates the WiFi channel that is being used (11 in your case). Some users have found that switching the channel helps. Others have needed to move the router closer or add a relay. There are a lot of products on the market today to provide better WiFi coverage throughout a building.