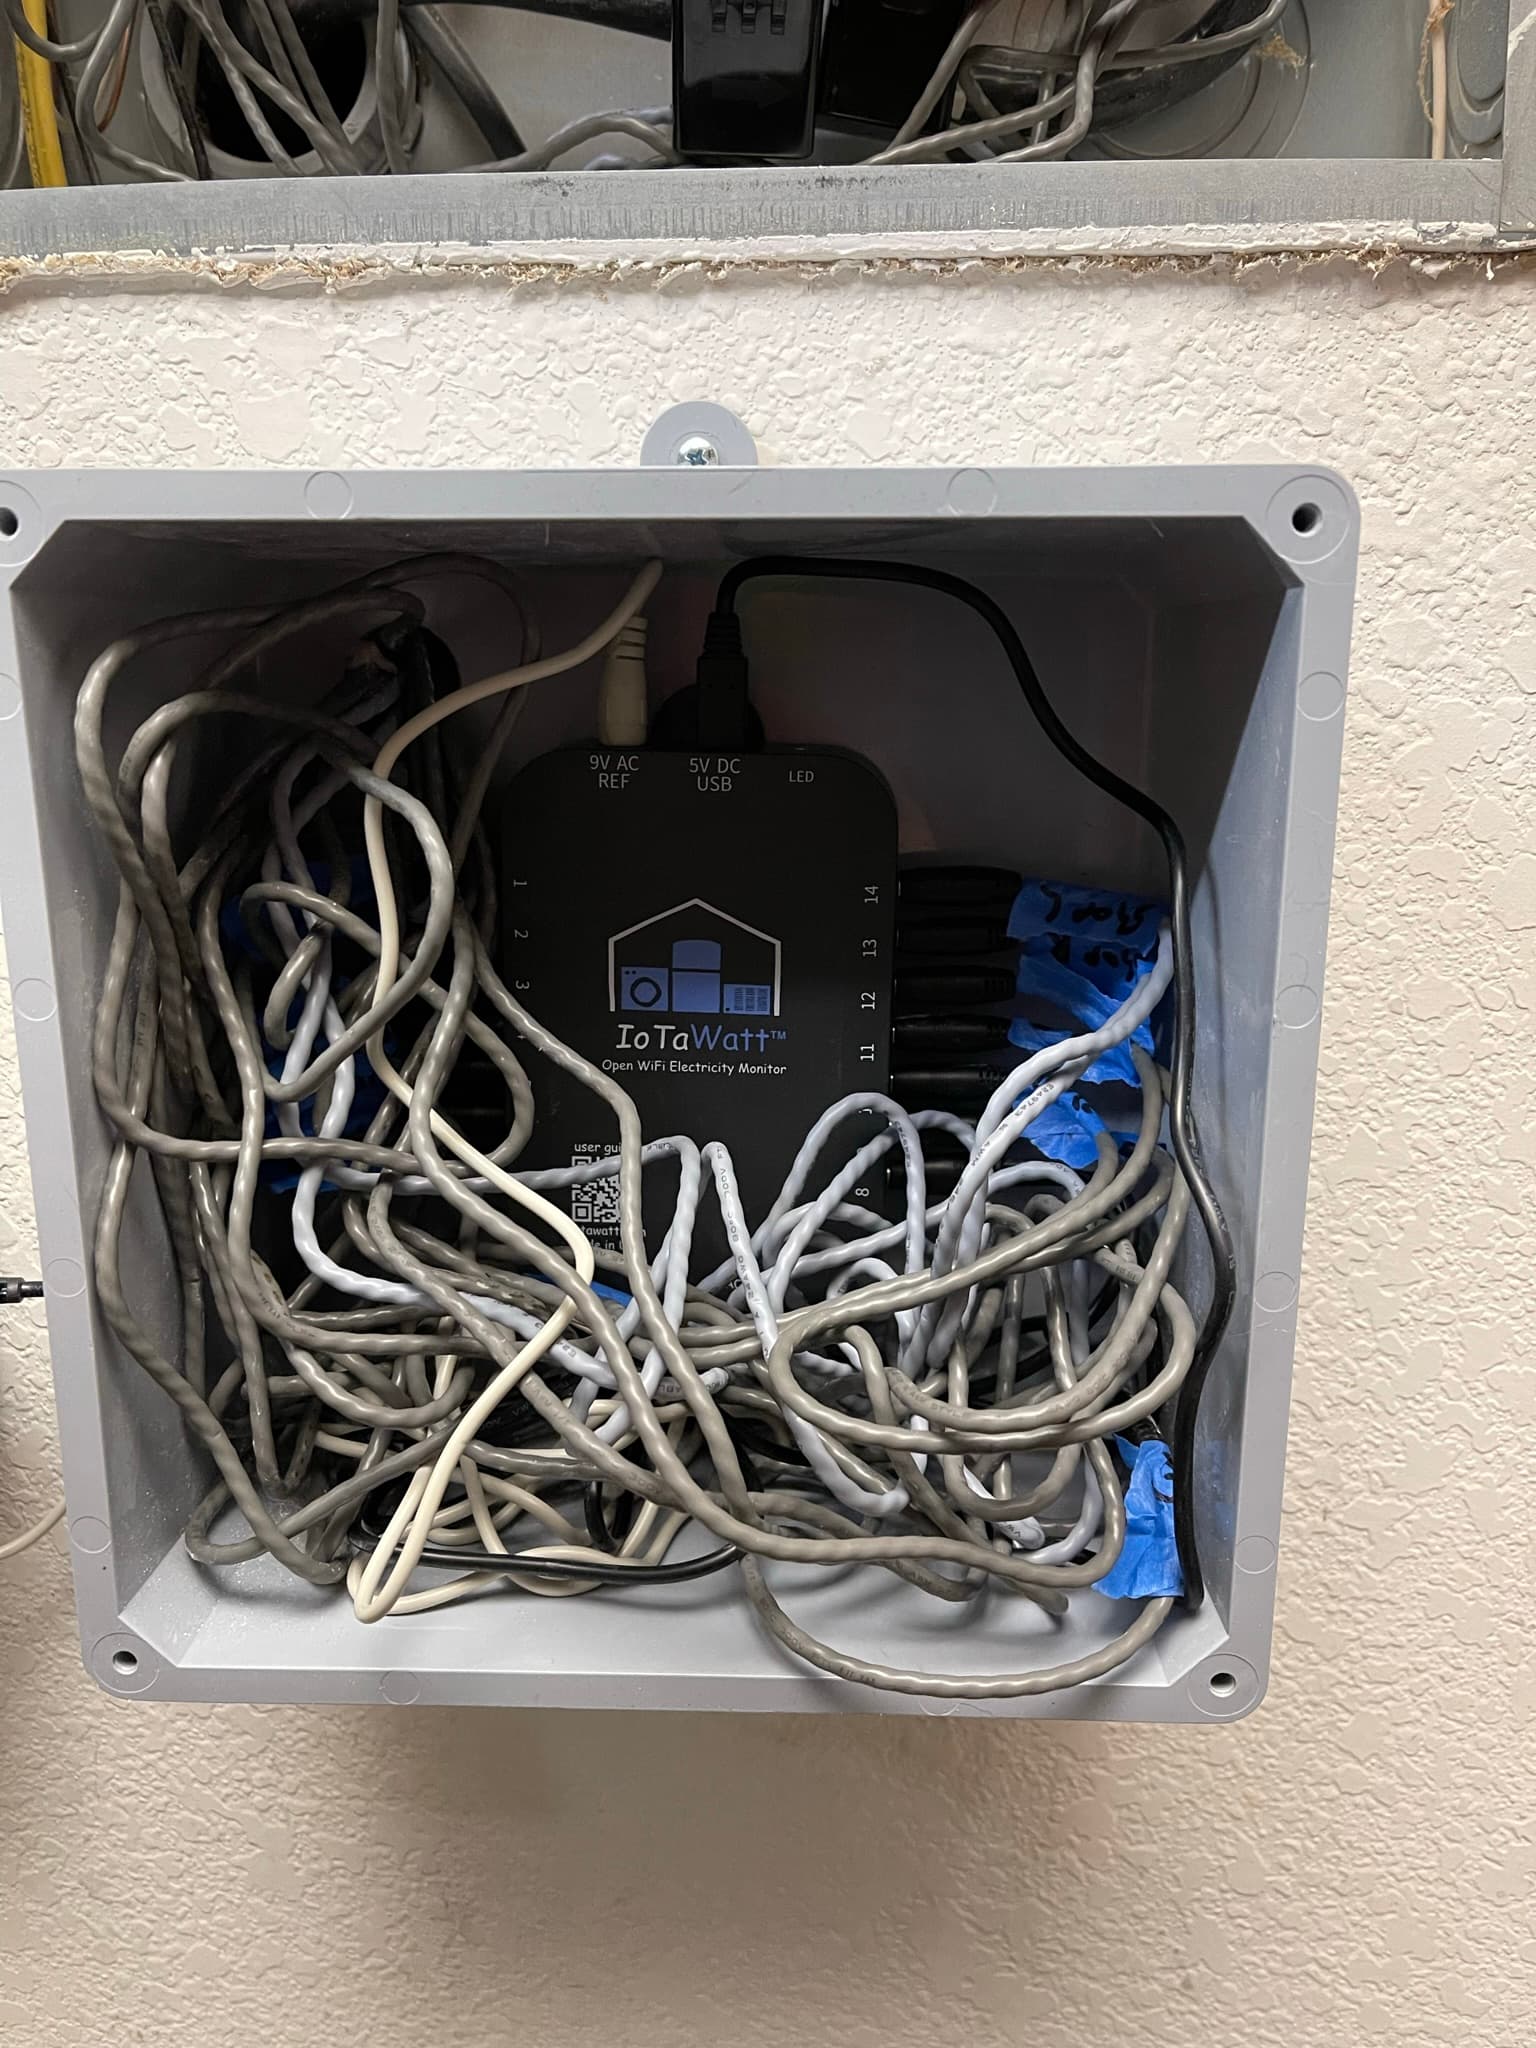
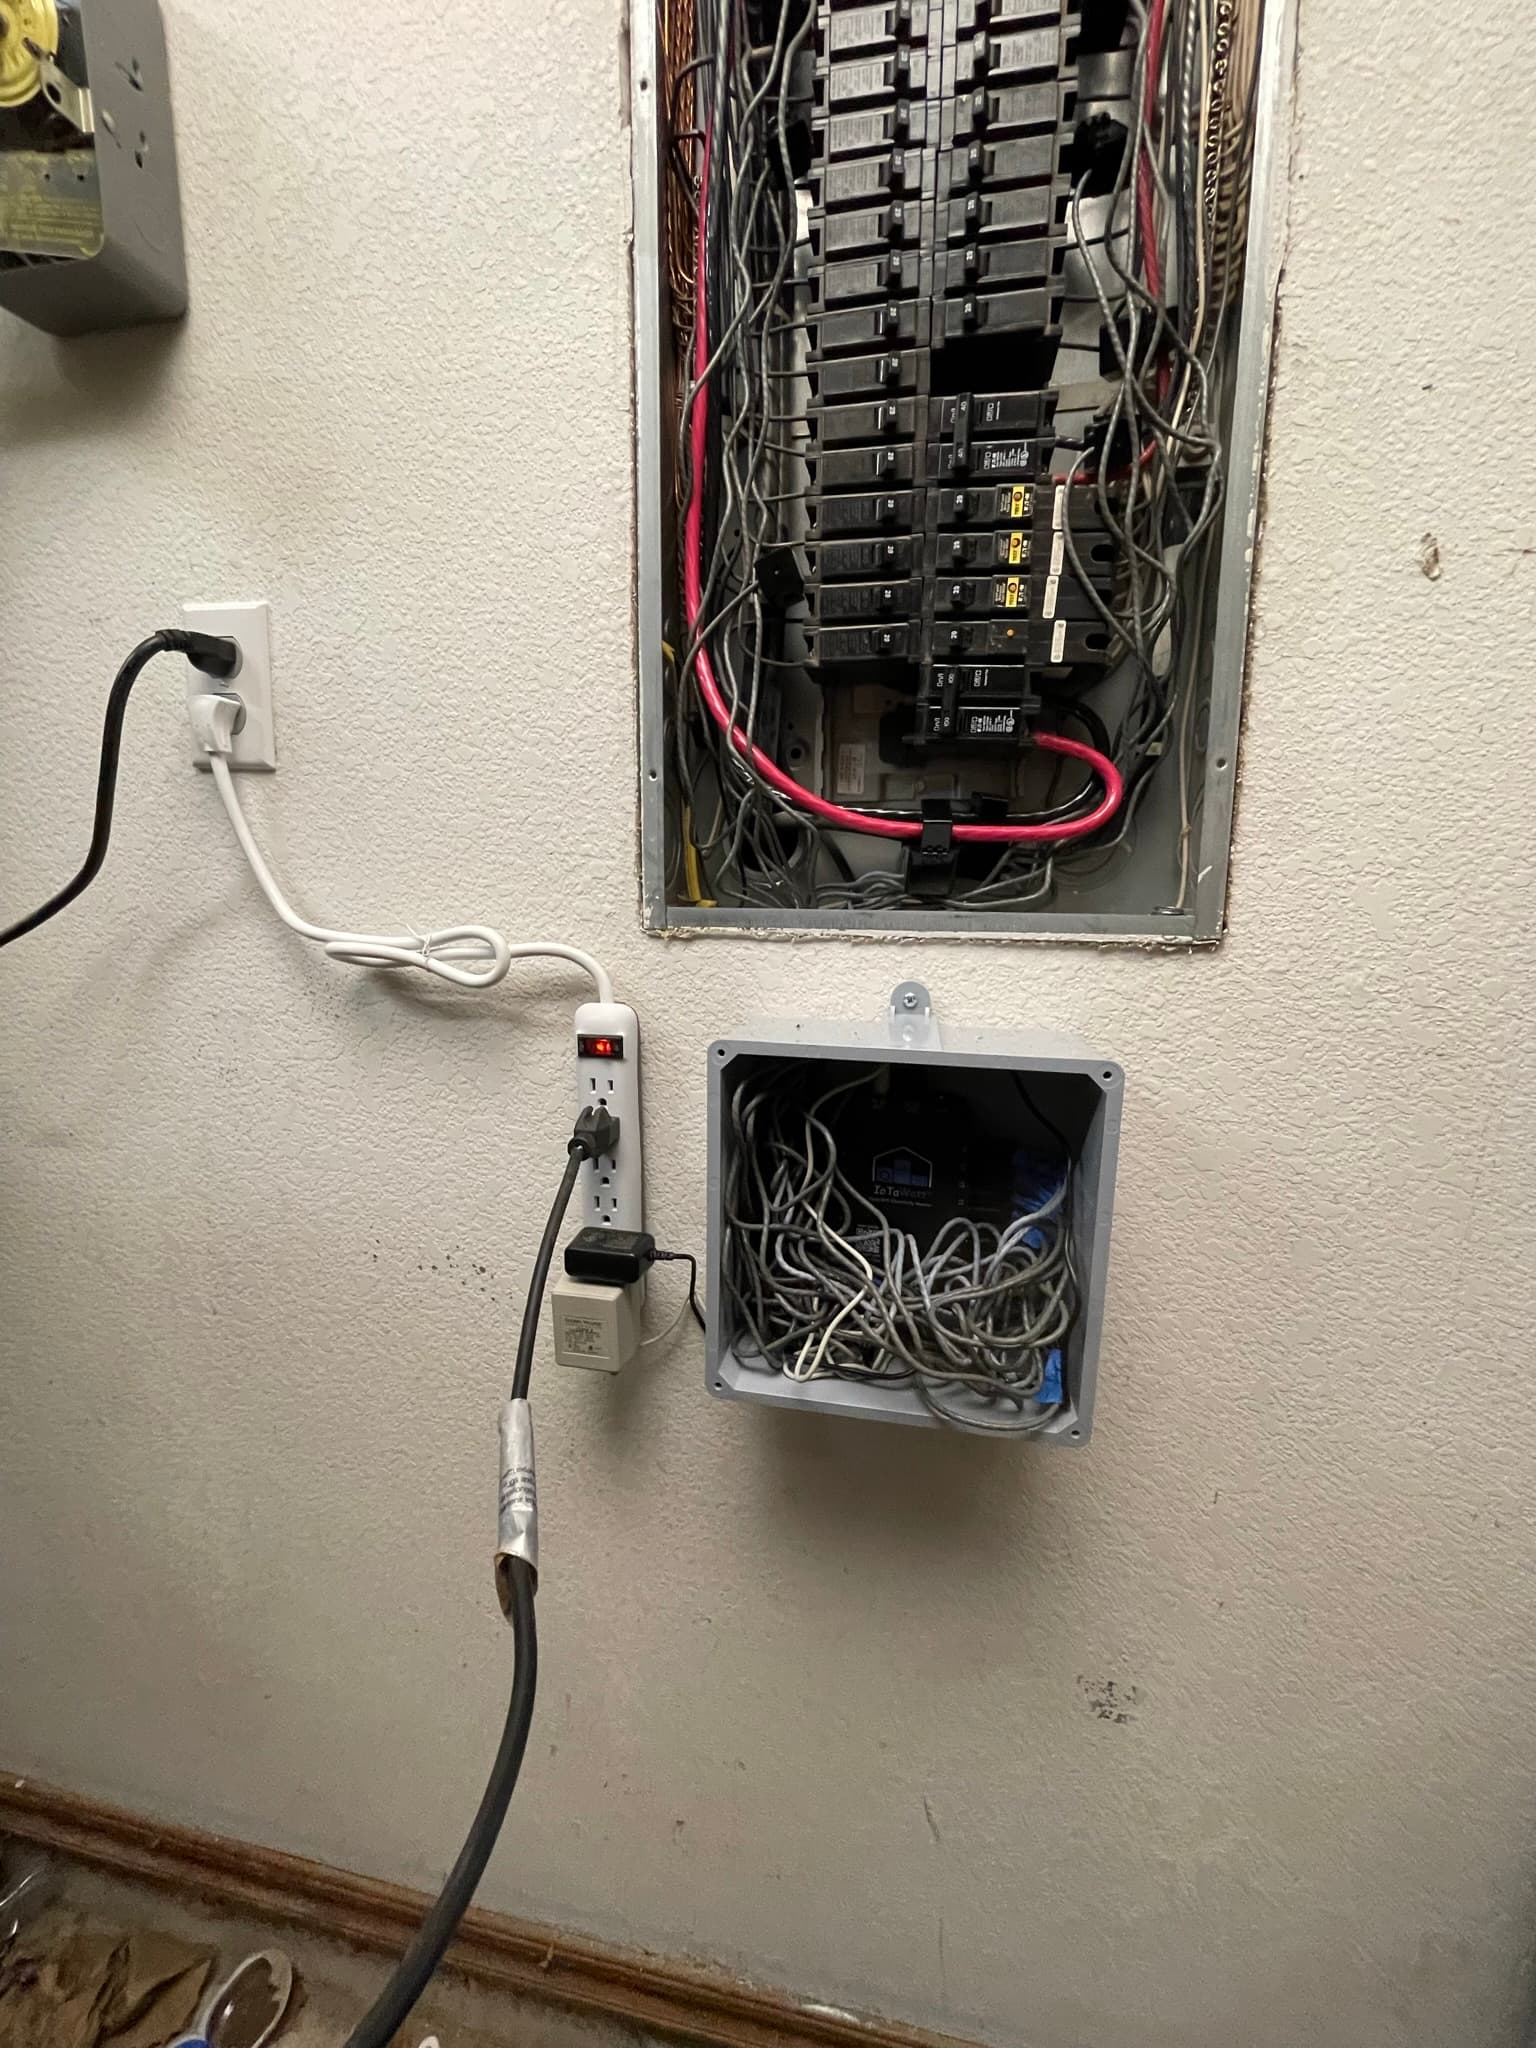
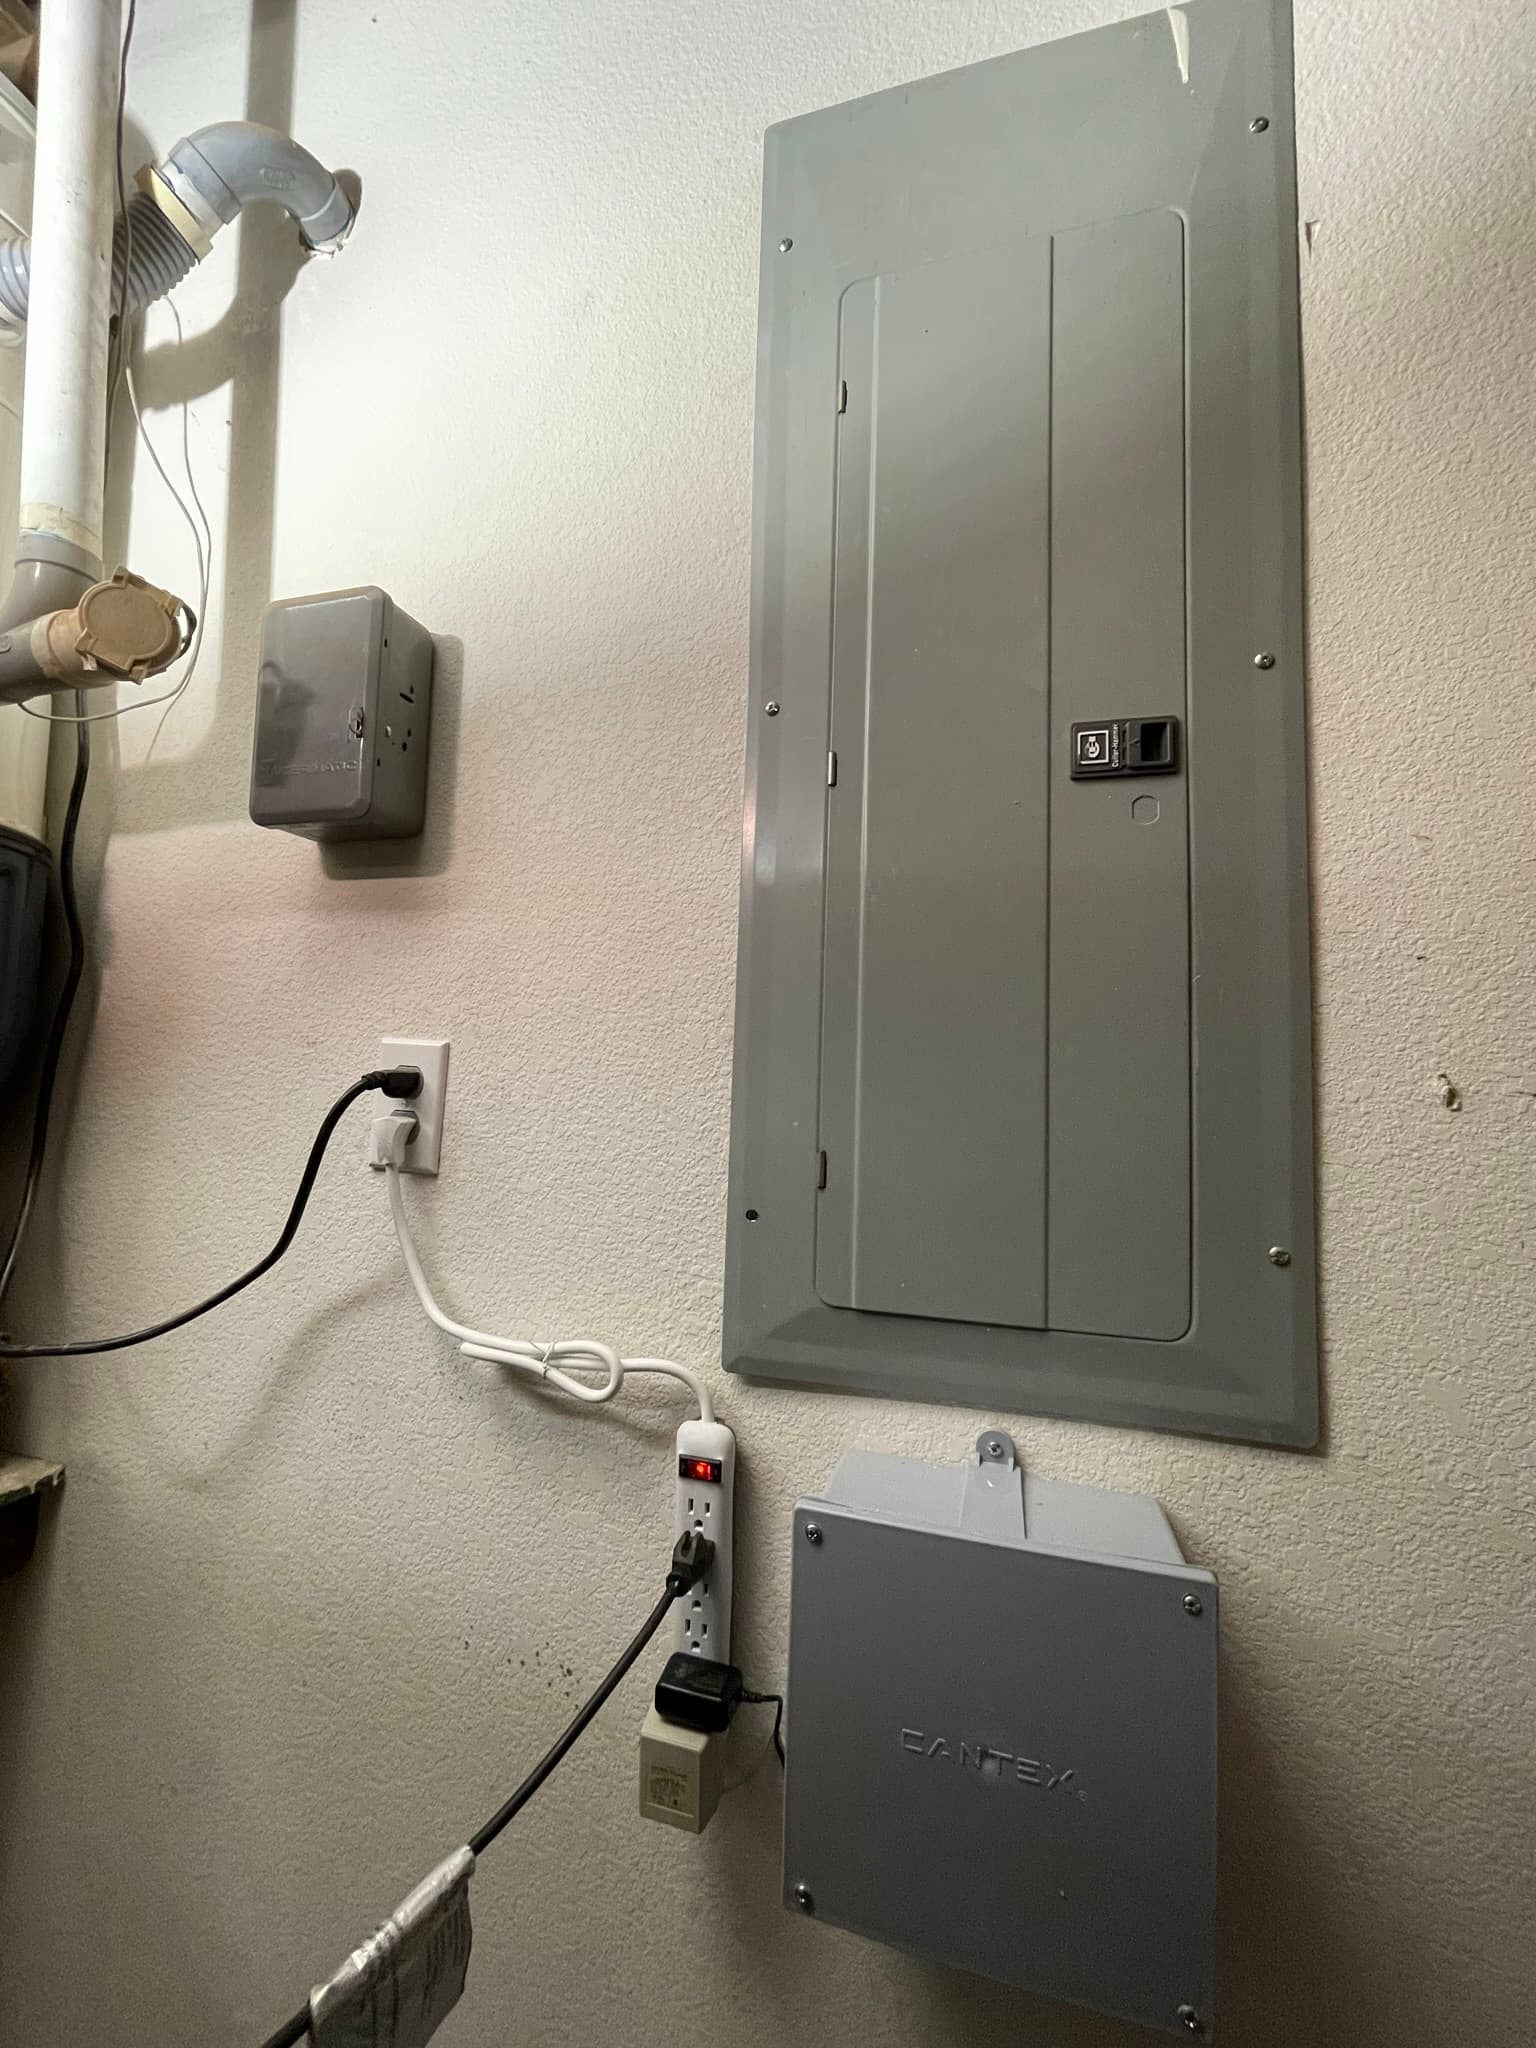
Just got IoTaWatt installed and all tucked away inside a “project box”. The cable management needs a lot of work, but everything is labeled and the system is fully functional. Now Im just going through the data export to InfluxDB v1. Any suggestions for the tag set and measurements? I’ll be building a Grafana dashboard with the data.
2 Likes
Have you read this?
https://brettbeeson.com.au/architecture-for-iotawatt-aws-influxdb-and-grafana/
Have you thought about what you really want to accomplish?
The built-in graphics of IotaWatt are actually quite powerful. The learning curve for InfluxDB and Grafana are fairly steep. InfluxDB recently moved to v2, but it is very different from v1. V1 has advantages for templating in Grafana. Luckily, the latest v2 allows read access via the v1 interface. The only reason I have InfluxDB and Grafana is because I have lots of other sensors and I want to have everything on the same page/graph (and I have two IotaWatt devices and I want to do math across them, which requires Flux and InfluxDB v2).
Unless you are willing to dedicate a lot of time for learning, I would suggest sticking with the built-in graphs. I have a saved one that shows me the energy utilization by day for the last week. I have another one (not saved yet) that shows monthly usage for the last year. Think about what you want to see and you will get help with how to visualize that (and what you will need to enable it).
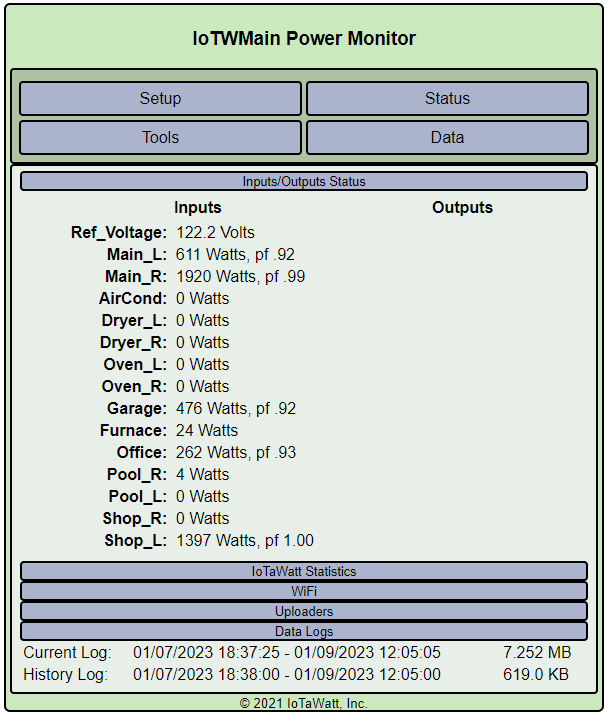
So, do you have the heat on in the shop? Or, is that the lights?
What is the furnace doing with only 24W? That is too low for most blowers and seems high for idle.
Your install looks a little neater/cleaner than mine, and I’ve had mine in place for a couple of years. It is on my list of things to do, but that seems to be ever growing.
1 Like
I use Grafana and Influx v1 to monitor a lot of other items around my house (Servers, Network Gear, Speed tests, etc.), and I make use of it at work (I’m a software architect) so I’m pretty familiar with the architecture from that perspective. You are correct, v2 is totally different animal.
The shop has a small space heater running, that is what is eating up that juice. As for the furnace, I think that is just the idle. I have a gas heat system and the air handler is not running at the moment. Its around 700w when the blower is running.
I’ll check out the link, and the list of things on my list is always growing as well, lol.
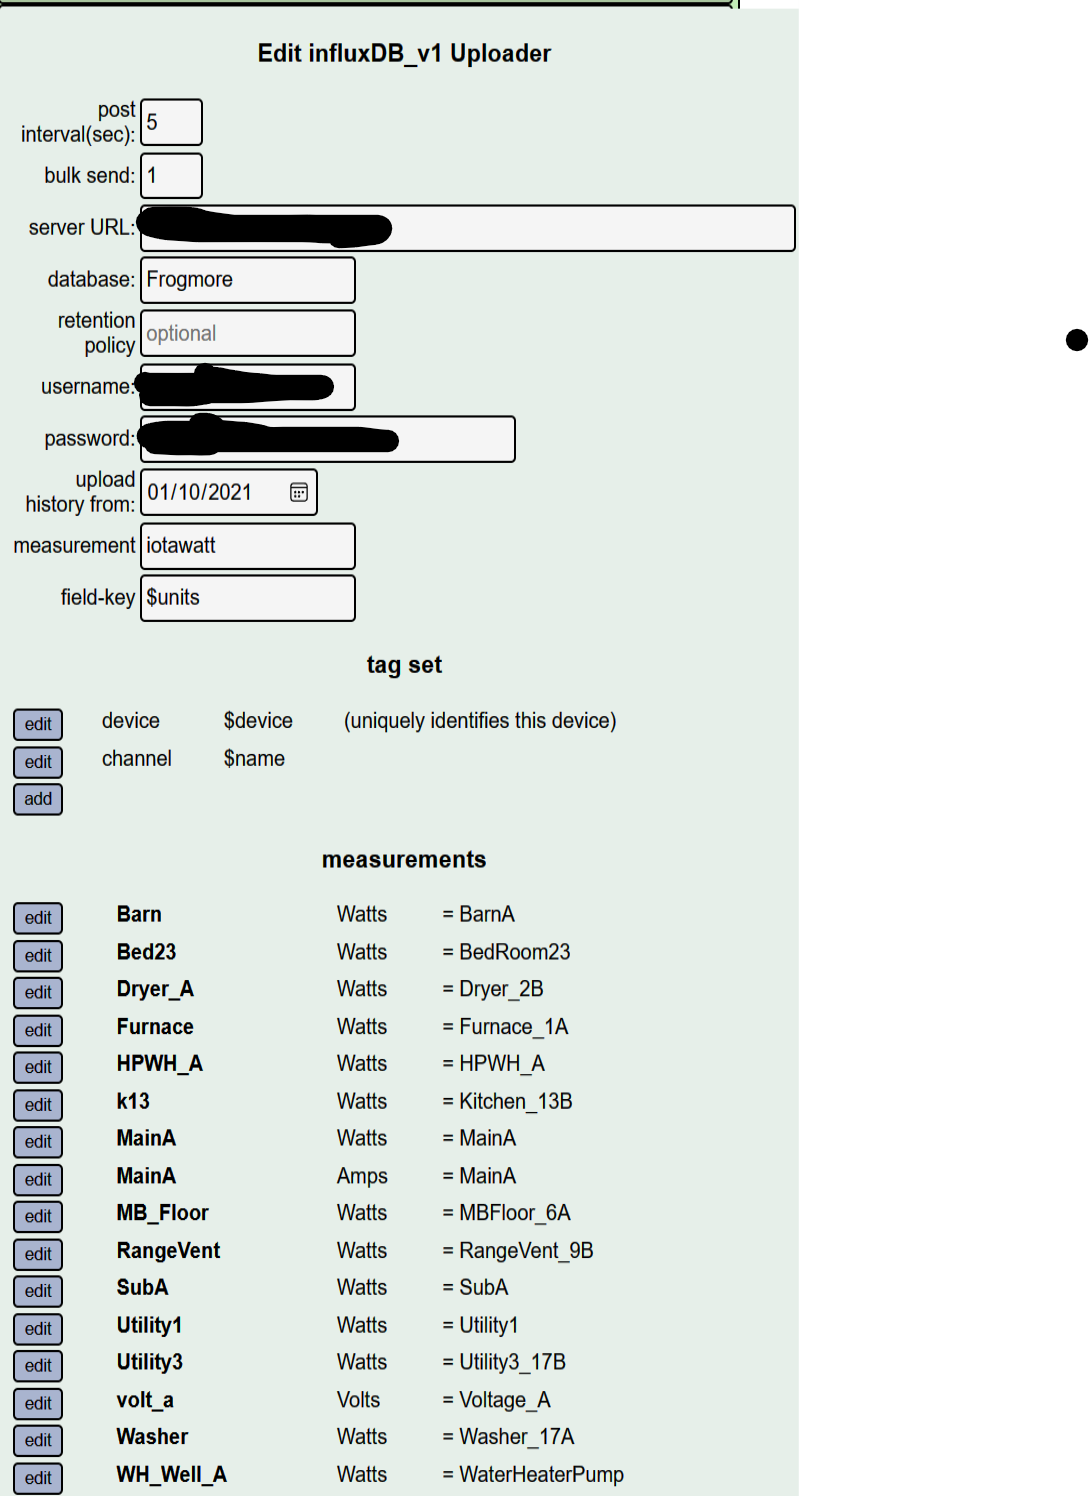
Here is what I use.
I have a local instance of InfluxDB and also for Grafana. I am thinking of moving to InfluxDB v2 for IotaWatt as I have that setup already (actually currently have 3 local instances, need to get all the stuff talking to the same one).
I have not set up the continuous queries to calculate KWh. It works okay to do it on the fly for less than a month or so. V2 replaces Continuous Queries with tasks, so I will use that.
Here is an example graph:
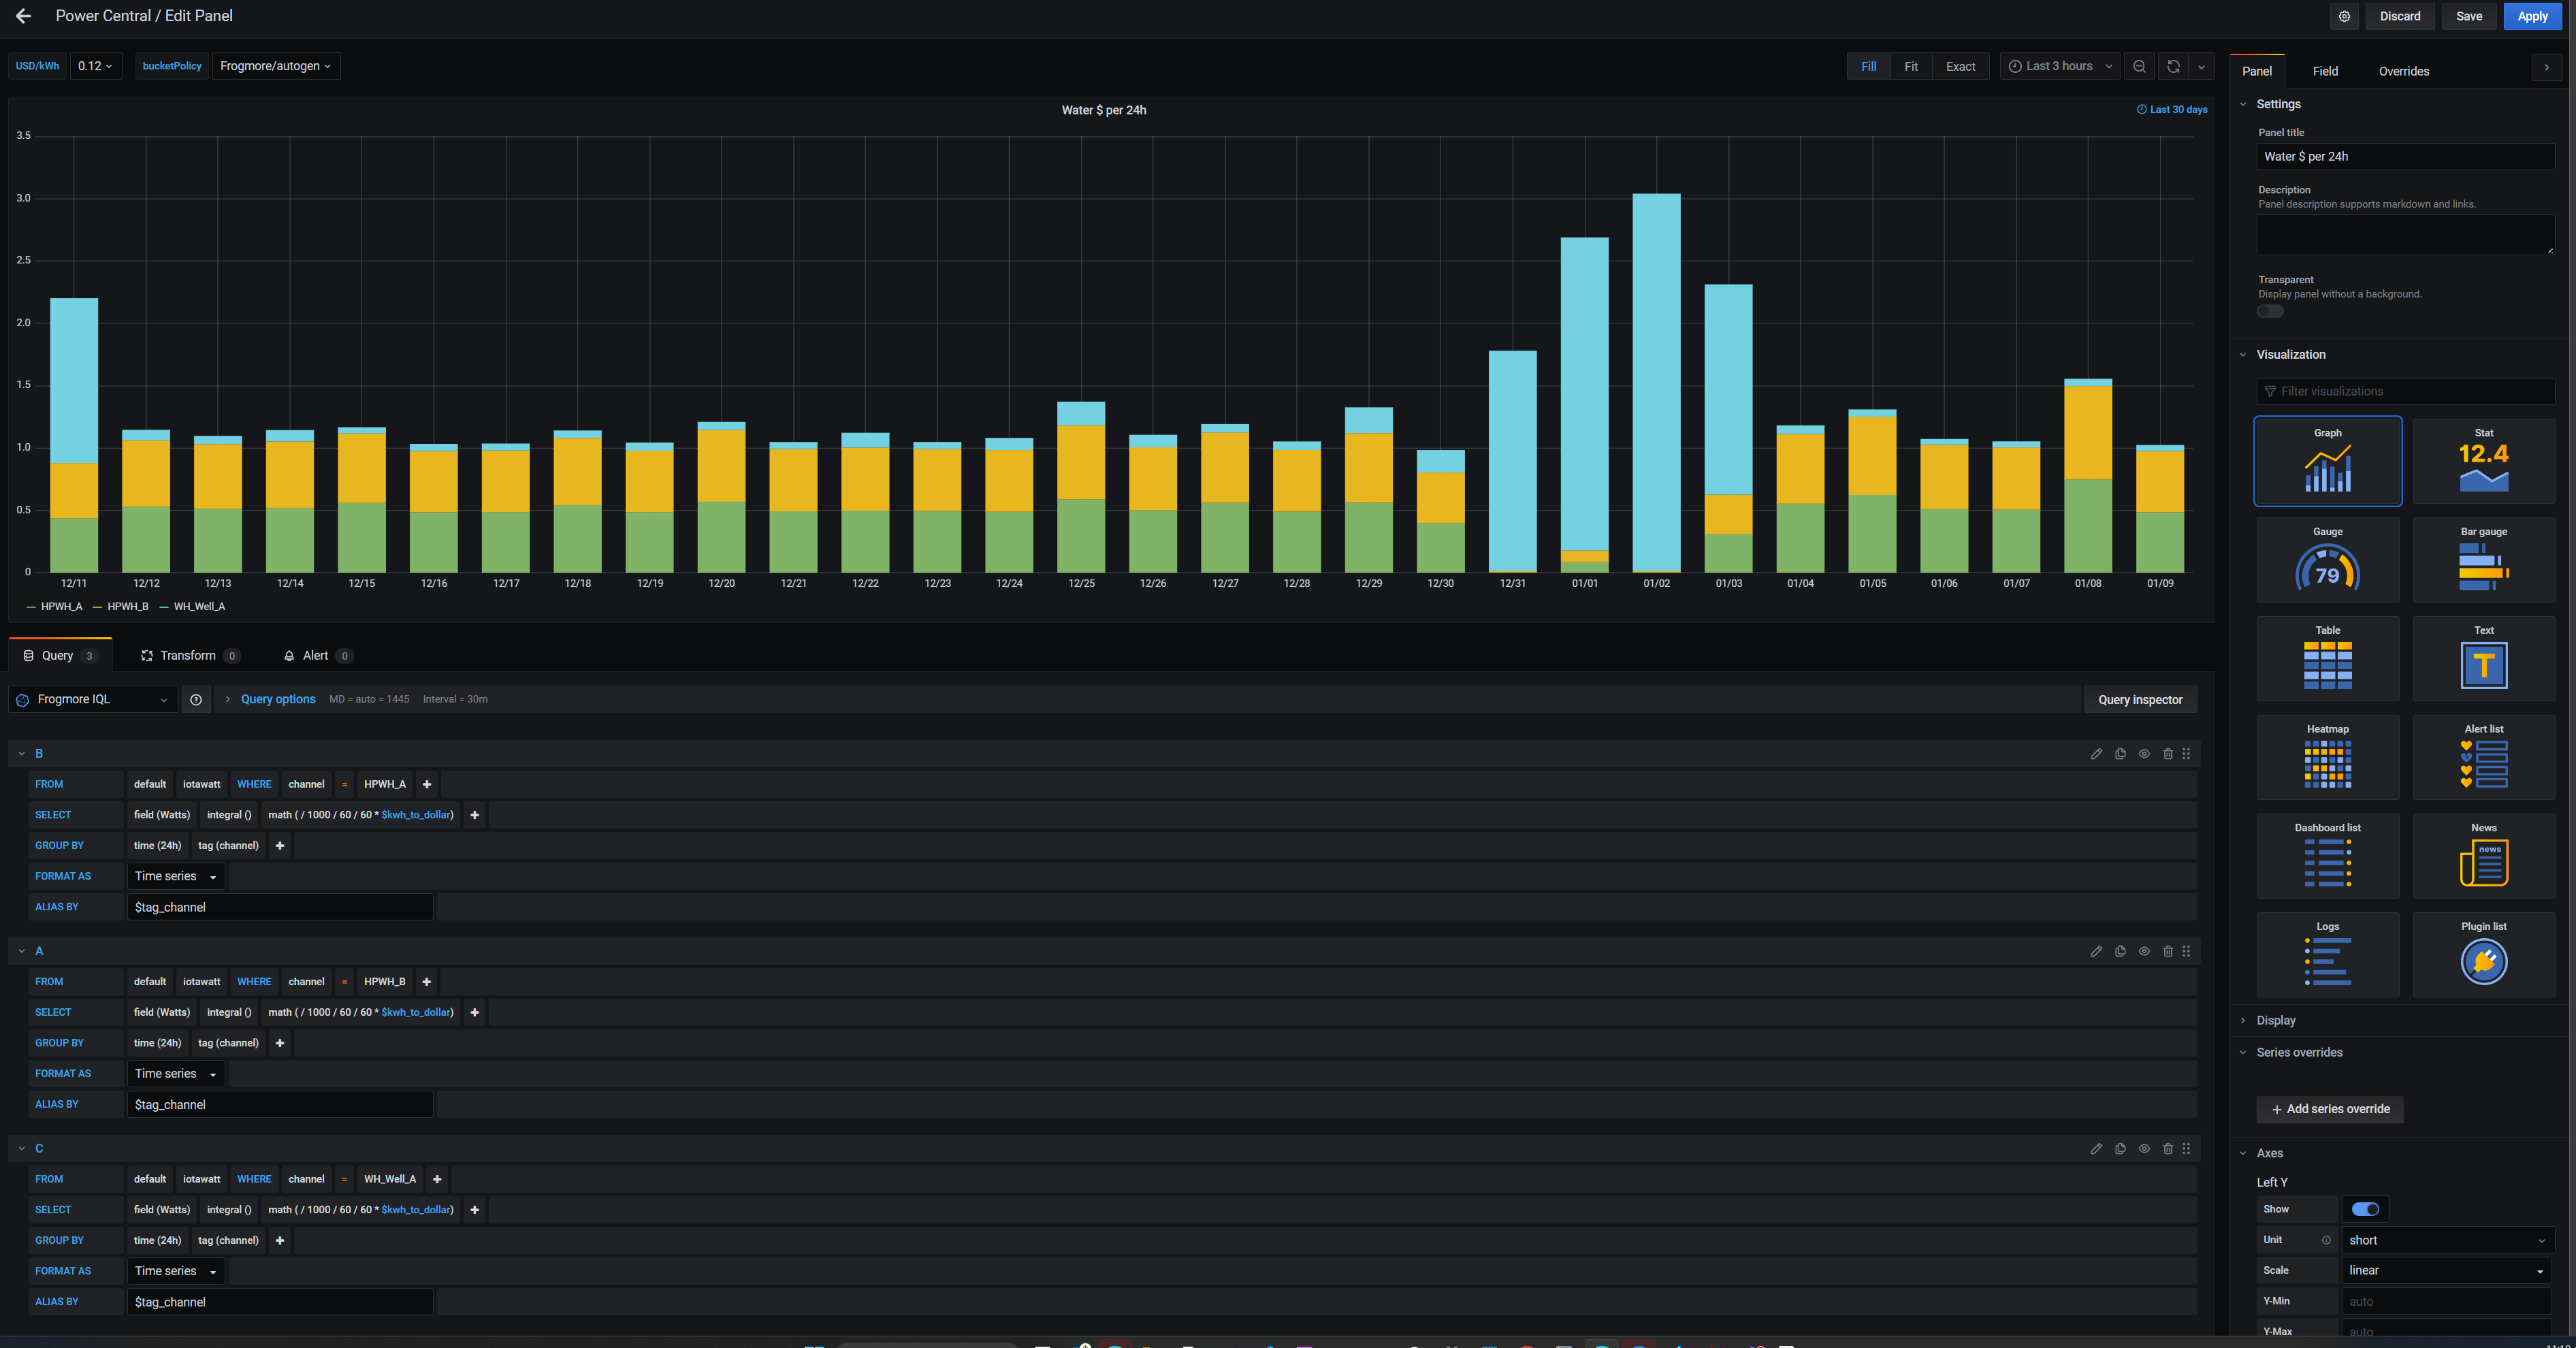
This shows some of the power of templating ($tag_channel), but my naming was such that a regex wasn’t easy enough and I just duplicated the queries.
The graph also shows the issue that happened with my HPWH on Dec 11. The heat pump stopped working and the temp of the tank was low, so the other regular water heater took over. At the end of the year, I did some work on the HPWH and had it off (draining the heat from it and then the actual water too). On the 8th there was another issue and I had to reboot the HPWH.
This is an example of a Flux query:
import "math"
FinalOutput = ["_field", "_time", "_value"]
MainA = from(bucket: "$bucketPolicy")
  |> range(start: v.timeRangeStart, stop:v.timeRangeStop)
  |> filter(fn: (r) =>
    r._measurement == "iotawatt" and
    r._field == "Amps" and
    r.channel == "MainA"
  )
  |> aggregateWindow(every: v.windowPeriod, fn: max)
  |> set(key: "_field", value: "MainA")
  |> keep(columns:FinalOutput)

MainB = from(bucket: "$bucketPolicy")
  |> range(start: v.timeRangeStart, stop:v.timeRangeStop)
  |> filter(fn: (r) =>
    r._measurement == "iotawatt" and
    r._field == "Amps" and
    r.channel == "MainB"
  )
  |> aggregateWindow(every: v.windowPeriod, fn: max)
  |> set(key: "_field", value: "MainB")
  |> keep(columns:FinalOutput)

join(tables: {MainA: MainA, MainB: MainB}, on: ["_time"])
  |> map(fn:(r) => ({
        _time: r._time,
        _value: math.mMax(x:r._value_MainA, y:r._value_MainB),
    }))
This query returns the max value for amps from the two mains. Since I am uploading 5 sec intervals, this is the 5s max over the whole period. I run this for today (last 24 hours) previous day, and last 30 days. Typical days are 40-50A peak with max of 77A, but average amps are much less (more like 10-15A).
Very cool stuff there! I like the cost per channel breakout you’ve got.
This is the link I used originally: IotaWatt: Multi-Tenant Setup using InfluxDB v1 – Brett Beeson
Note that the units tag set to $units (along with the field-key set to $units) caused me a lot of confusion, as it didn’t work. I am not sure that even if it did it would be really valuable. You can filter on tags much easier than on fields (not at all) but I haven’t found a need for it.