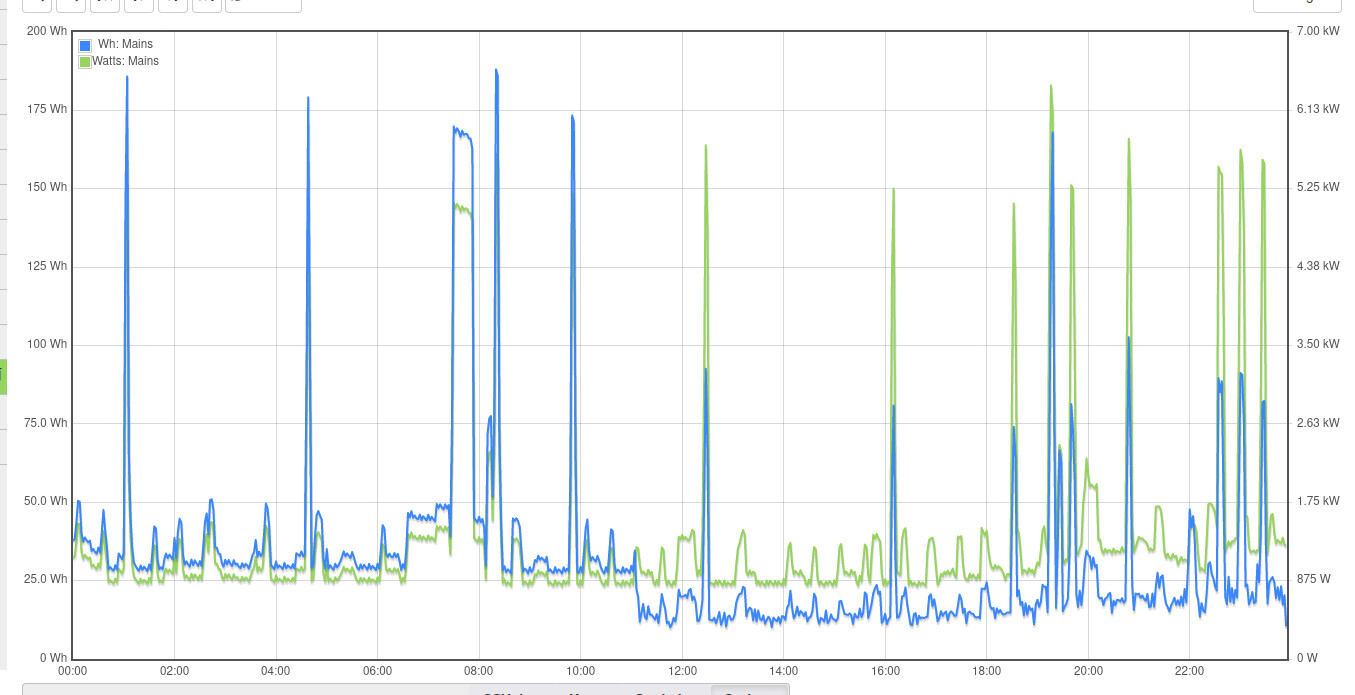
The other day I had the watt hours drop by about half for no reason I can explain. The watts didn’t change. Event happened around 11am. Around that time I had updated home assistant and the machine I run it on. Figured it was an issue there, but when I looked in my IoTaWatt to confirm the data I also saw the drop there. What should I be checking to figure out how to fix the data?
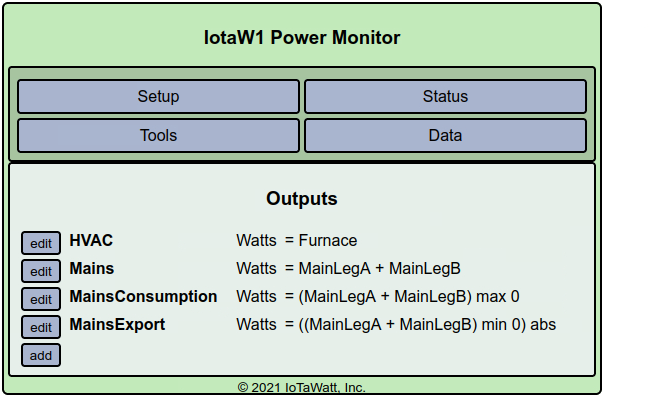
Is Mains an output or integrator? Can I see where it is defined?
Mains is an output
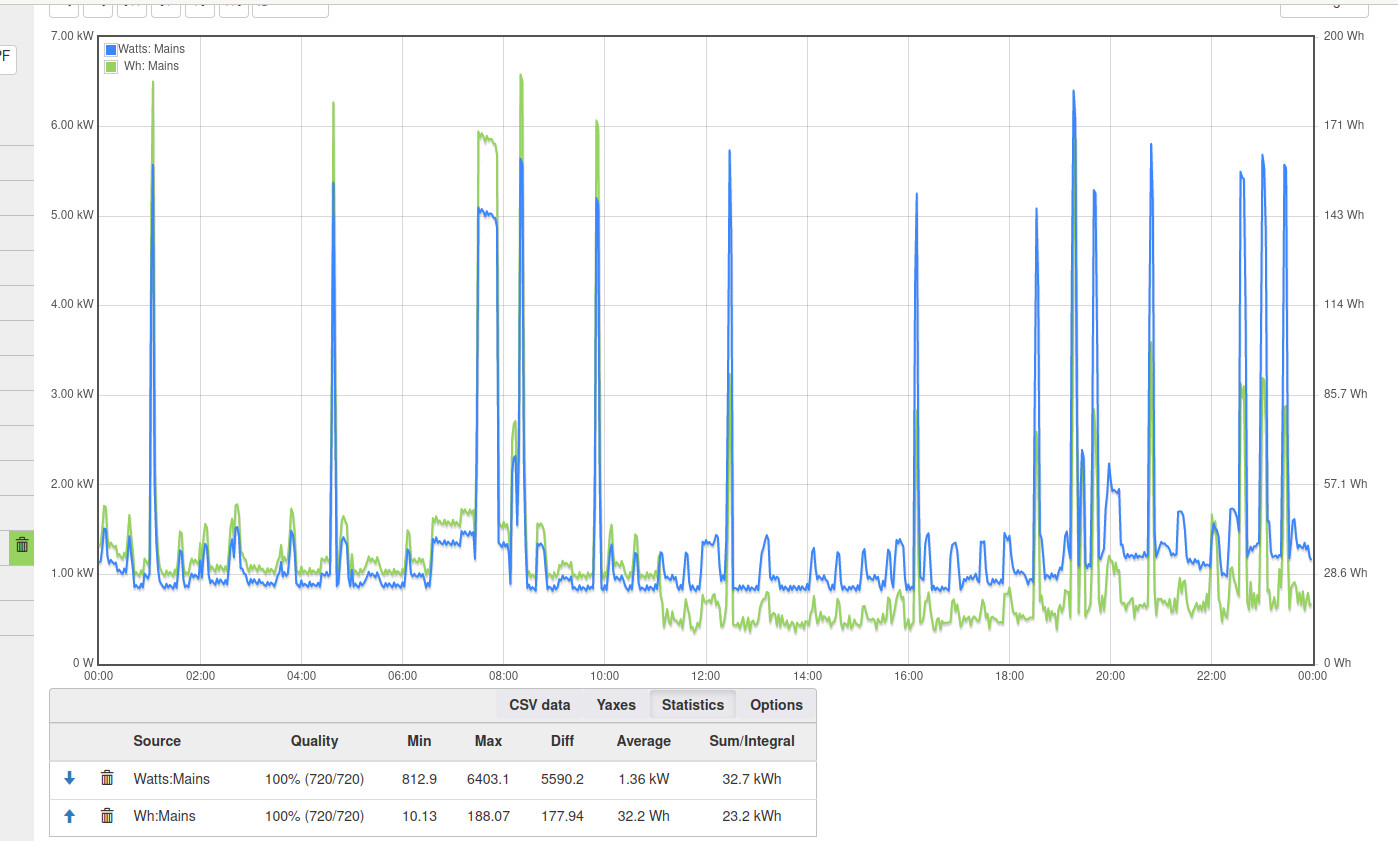
Puzzling. Can you show that graph with the statistics tab exposed please?
Can you post the message log please?
Think I figured it out. The emoncms instance I had setup on my homeassistant machine didn’t fully come back up after the reboot. It’s redis server didn’t start up and emoncms is throwing php errors. I deleted the emoncms uploader config and the IoTaWatt stopped rebooting.
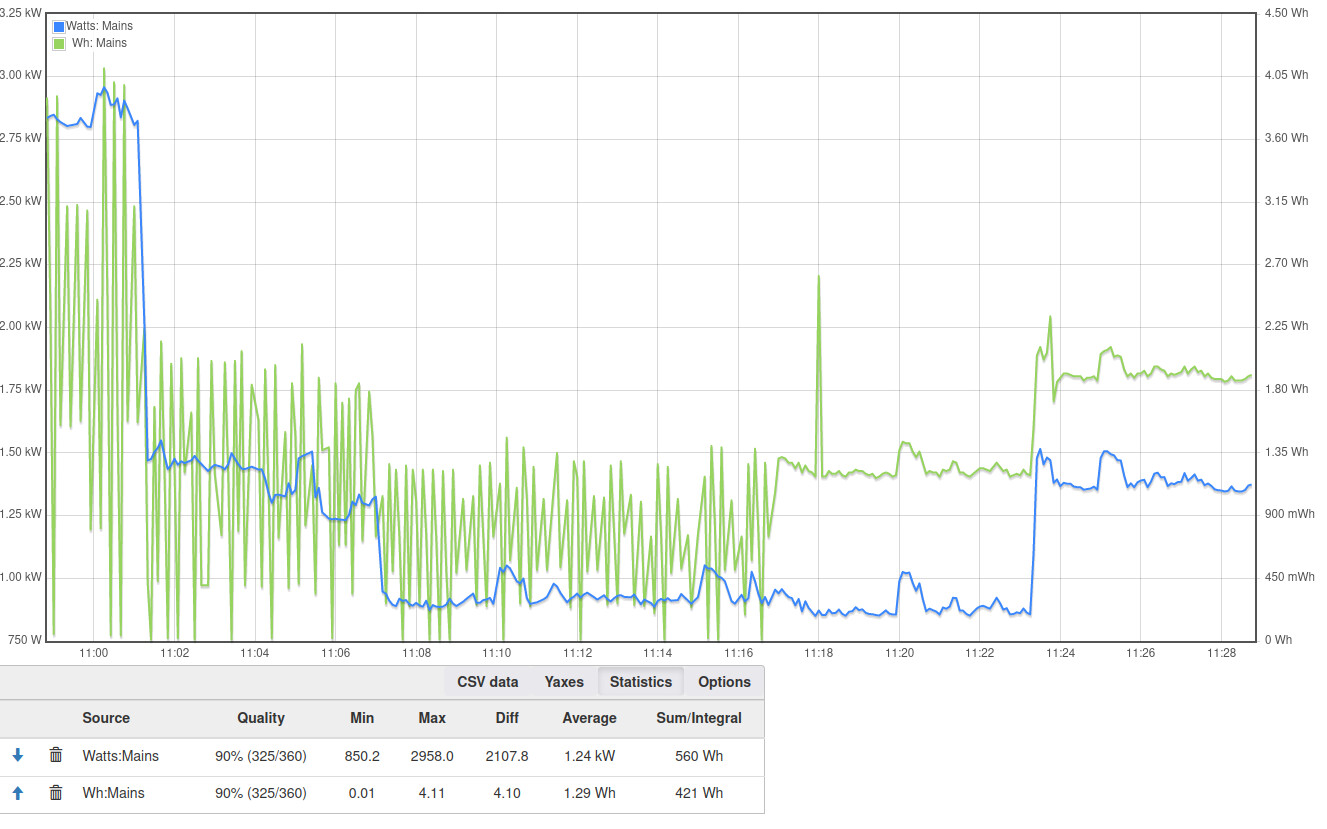
Here’s yesterdays graph with statistics.
Here’s after I turned off the emoncms uploader
Looks like somewhere in the uploader the error response from emoncms is causing issues.
Here’s the message log.
iotamsgs.txt (9.7 KB)
That appears to be the problem. If you set the low Y axis for Watts to zero the two should lie right over each other,
The PHP errors in Emoncms causing restarts is a relatively new issue. The error response is a large HTML file and is using up available memory. I’m looking into a way to bulletproof, but in the meantime you need to avoid those errors in Emoncms.
I’m just going to drop emoncms. It was a pain to get setup and I didn’t even have it fully setup. Was going to use it to aggregate the data from my IoTaWatt and solar system, but I think I’ll just do that in homeassistant.
Here’s the error response I get from emoncms if it’s of any help debugging. Let me know if there’s any data that I can pull that would be of use.
emoncms-err.txt (494 Bytes)
If you can get the solar output into the IoTaWatt, I think you can do everything with Graph+.