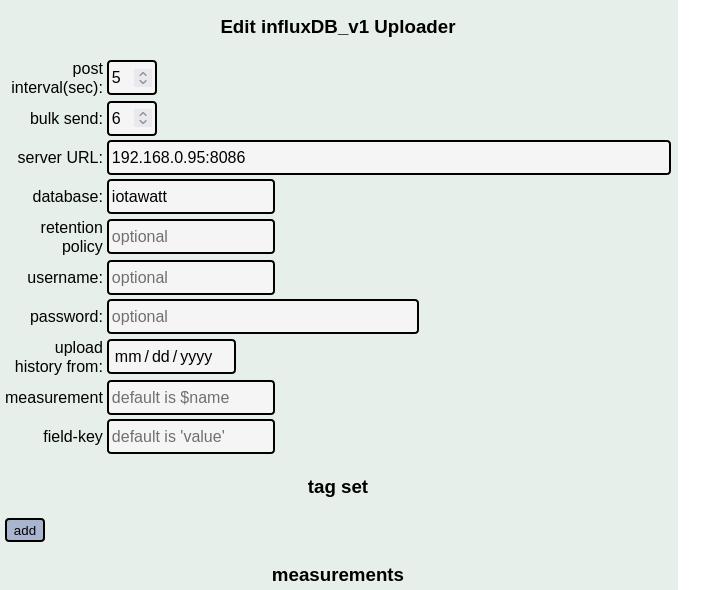
New user here. Just got my IotaWatt installed and pumping data to my existing influx/grafan install. I got watts and amps logging but set up a uploader for watthours.
I’m trying to figure out how I can use that to display usage by day / week / month, etc. And maybe even calculate a cost to it.
Am I correct in thinking I can just use sum with what Iotawatt is sending? (Wh = MainFeed1 + MainFeed2)
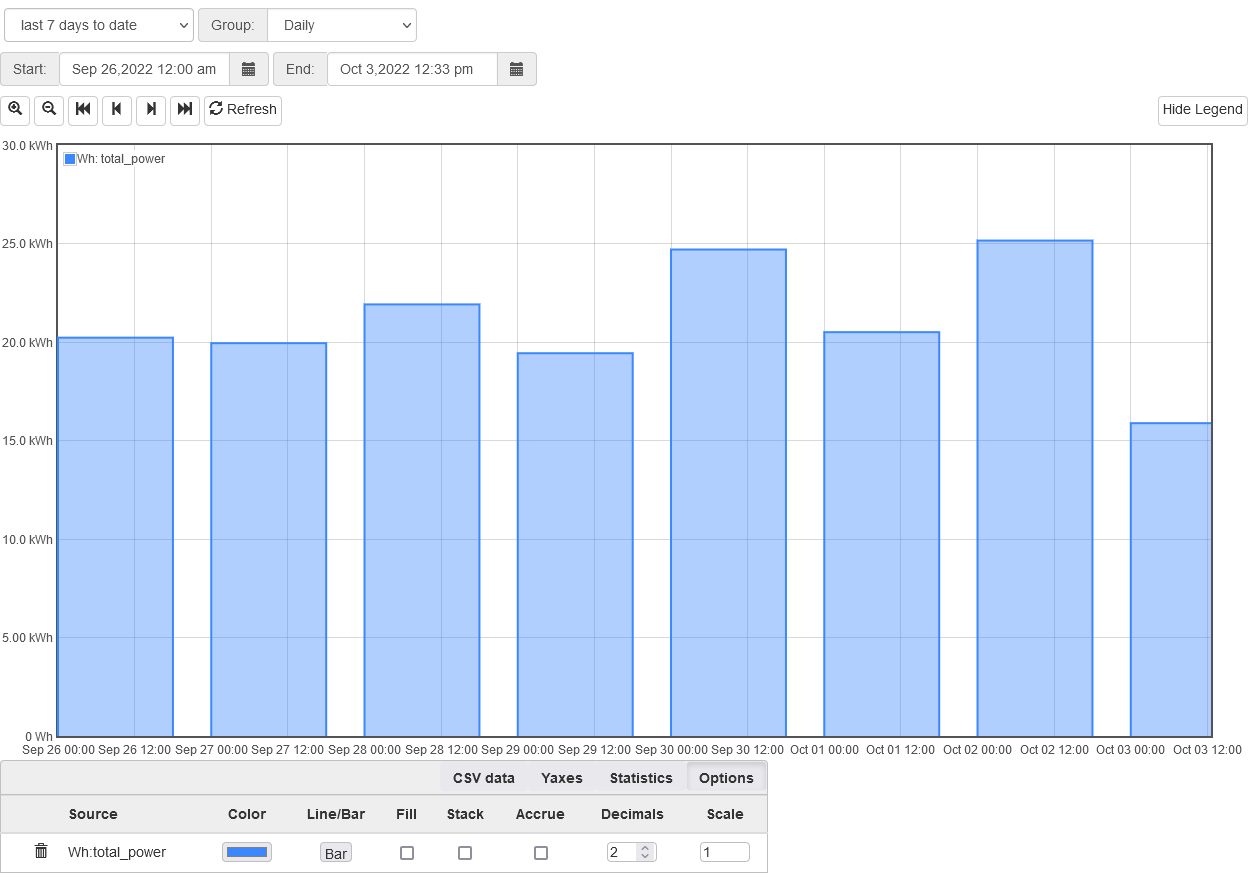
I was thinking something like this on a bar chart for day / week / month, etc.
SELECT sum(“value”) FROM “MainWattHours” WHERE $timeFilter GROUP BY time(1d) fill(none)
I finally got around to playing with this a bit more now that it’s been running and logging data for a few weeks.
The values I get for KW/h from Graph+ like you posted above match what I’m seeing from my electric company.
But I’m struggling to get my Grafana graph to match. The values are close, but off by a couple tenths each day. For example yesterday I see 17.5 in graph+, and 17.94 in Grafana. This is the query I’m using to look at usage by day. “MainWattHours” is just WH and my CT’s on the main breaker feeds.
I gotta be missing something simple in my graph but I’m stumpped.
SELECT sum("value") FROM "MainWattHours" WHERE $timeFilter GROUP BY time(24h) fill(previous)
Not a lot to go on here, but it’s possible this is just a time zone issue. IoTaWatt uploads using UTC, and so your data is UTC. Grafana needs to know the local time-zone in order to query the correct start and end times in UTC.
I kinda went down that rabbit hole but didn’t come up with much. I noticed my bars are getting drawn at 20:00 instead of midnight, but changing -4EST to UTC just shifts the time axis so the bars are right on at midnight, but the values don’t change.
The other thing I keep thinking of is wouldn’t influx/grafana have to know how often Iotawatt is posting the watthours field? In my case it’s every 5 seconds. Maybe I’m over thinking it.
It’s not the end of the world, but it’s going to bug the crap out of me until I figure it out.
Just another thought. Is Graph+ calculating WH based on watts, or is it using stores WH stats like I’m uploading to Influx?
Sure. It’s a mess because I just started adding stuff before I really knew what I was doing.
And when I created the iotawatt database in influx I just used all the defaults. Main1 and Main2 are the main feeds in my panel that I’m working with on the graphs here.
Thanks for this post, I found it useful. I am in the process of testing out influxdb v2 and flux. So if anyone wants the flux query for this it looksl ike this:
// Setup your timezone info so that the day resets for you correctly.
import "timezone"
option location = timezone.location(name: "America/Los_Angeles")

// Query to grab Watt hours from db
from(bucket: "iotawatt_new")
  |> range(start: v.timeRangeStart, stop: v.timeRangeStop)
  |> filter(fn: (r) => r["_measurement"] == "Main_wh")
  |> filter(fn: (r) => r["_field"] == "value")
//  |> map(fn: (r) => ({r with _value: r._value / 1000.0})) //To convert to kWh if needed, but latest grafana changes scale for you automatically
// sum the values by day.
  |> aggregateWindow(every: 1d, fn: sum)
// give the counter a friendly name.
  |> map(fn: (r) => ({_value: r._value, _time: r._time, _field: "Main Wh"}))

  |> yield(name: "mean")
Brilliant idea. I’m just starting out in flux so not sure I’ll be able to contribute much of any use but looking forward to learning and contributing if and when I can.
Thanks for this @crzykidd I am using it as the basis for my power monitoring dashboard.
The only issue I have is with the time stamps on my graph. They are all a day advanced. So for example todays (11-16) stats show up as tommorow (11-17 00:00:00).
I am in UK and have location set to Europe/London in the query.
Any idea where I have gone wrong and how I can fix it?
So ELI5. Flux is is a dashboard that would replace grafana, right?
I like the support of these queries but really don’t feel like switching everything I’ve got built over. I’m using influxv1 and grafana pretty heavily for all my IOT/network monitoring stuff.
@scoob8000 I’m not an expert here but as I understand it flux is a query language that replaces influxql in later versions of influxdb. It can be used in grafana so doesn’t replace it at all. If you are heavily invested into influxdb v1.x using influxql with grafana I can see the pain it would be to migrate to influxdb v.2.x.
I’m just starting out so decided to go for v2.x as that seemed to be the sensible thing to do. Having a long learning curve getting my head around flux though. If I was in your shoes I’m not sure I would migrate either. But I’m sure some of the experts on here will give you more pro’s and con’s for doing so than I can give you.
I’m running mine in docker containers on my NAS so no reason why you can’t. You will need to be mindful of what ports you use to access which version is the only complication I can see.