Waveform ('cycle') sample output

Hi Bob and Iotaers,

The goal/background: to get more information on aggregated downstream usage. Recording samples at <5s intervals was not fruitful as you’ve implied in forums - see detailed notes. Instead I’d like to investigate the ‘signature’ of the I, V waveform (as you see in an oscilloscope on the VT and CT).

Specifically, I’d like to ‘capture’ the sampled current and voltage waveform for later download or upload to a database. I’ve made some progress, but can’t seem to find the right array to save. I’m looking for help in implementing this myself - this ain’t no feature request!

Steps so far (also see detailed notes, and the new service source repo)

  • Build from source (really easy with PlatformIO and VSCode - nice job) and check src works unmodified.
  • Create a new ‘service’ called cycleSaverService which
    • runs each 10s
    • waits until “lastChannel” global variable is the one we want to capture
    • iterates through sampleV and sampleI of length ‘sample’ to record the last channel’s sample
  • Used the orphan function “printSamples()” to view the samples

Expected to see:

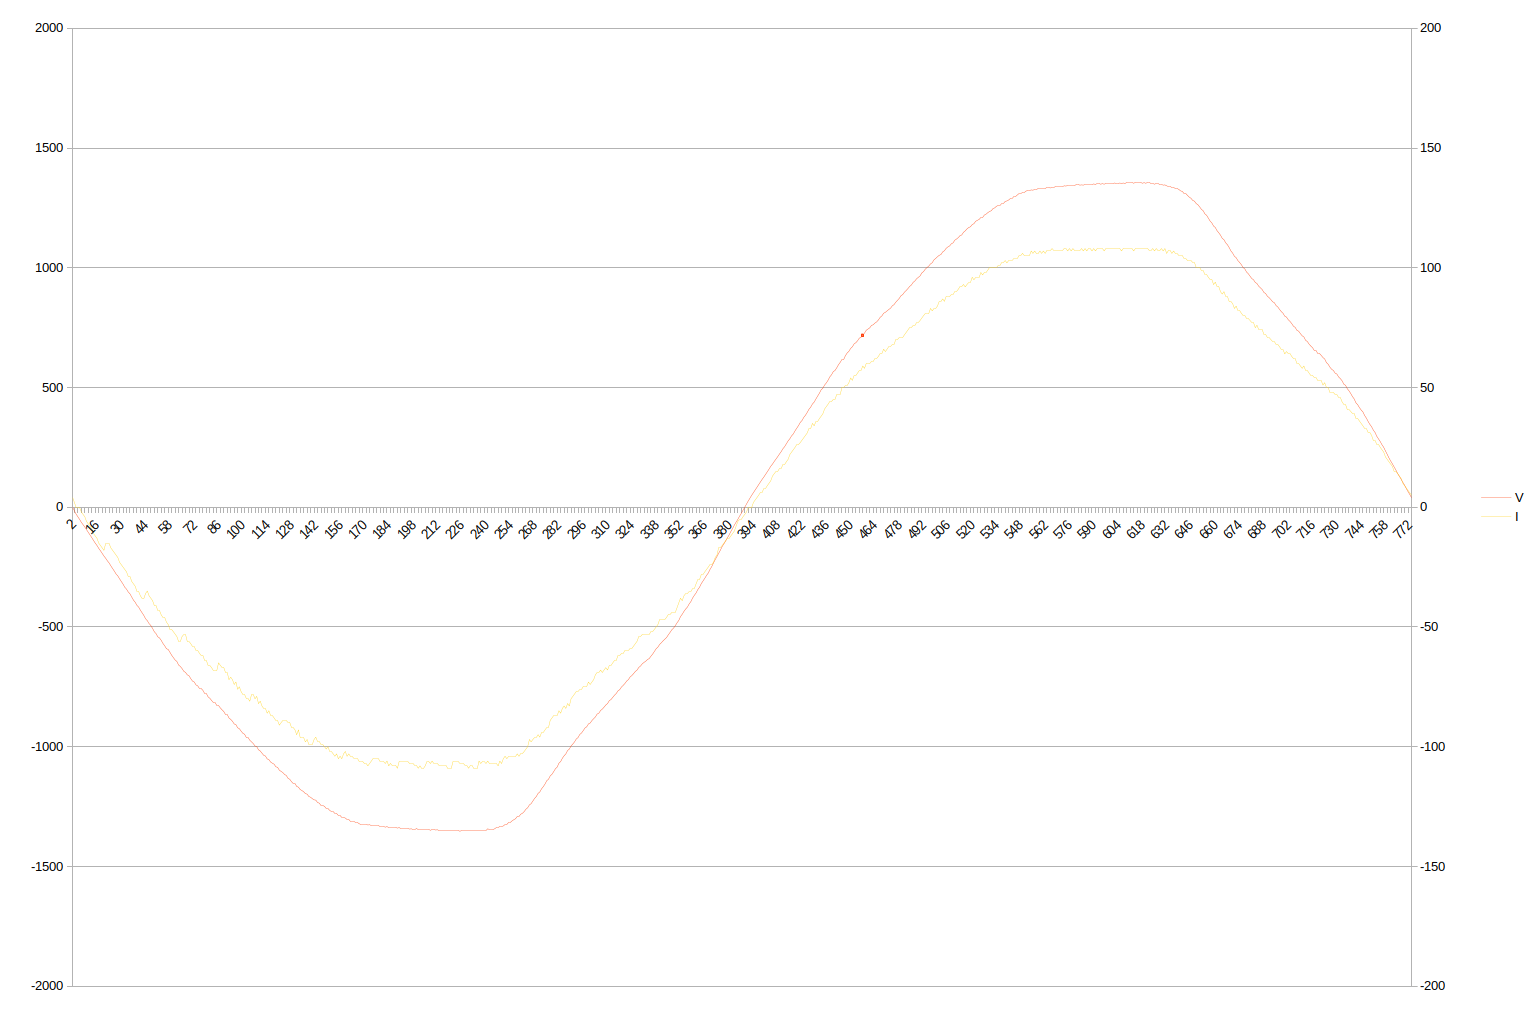
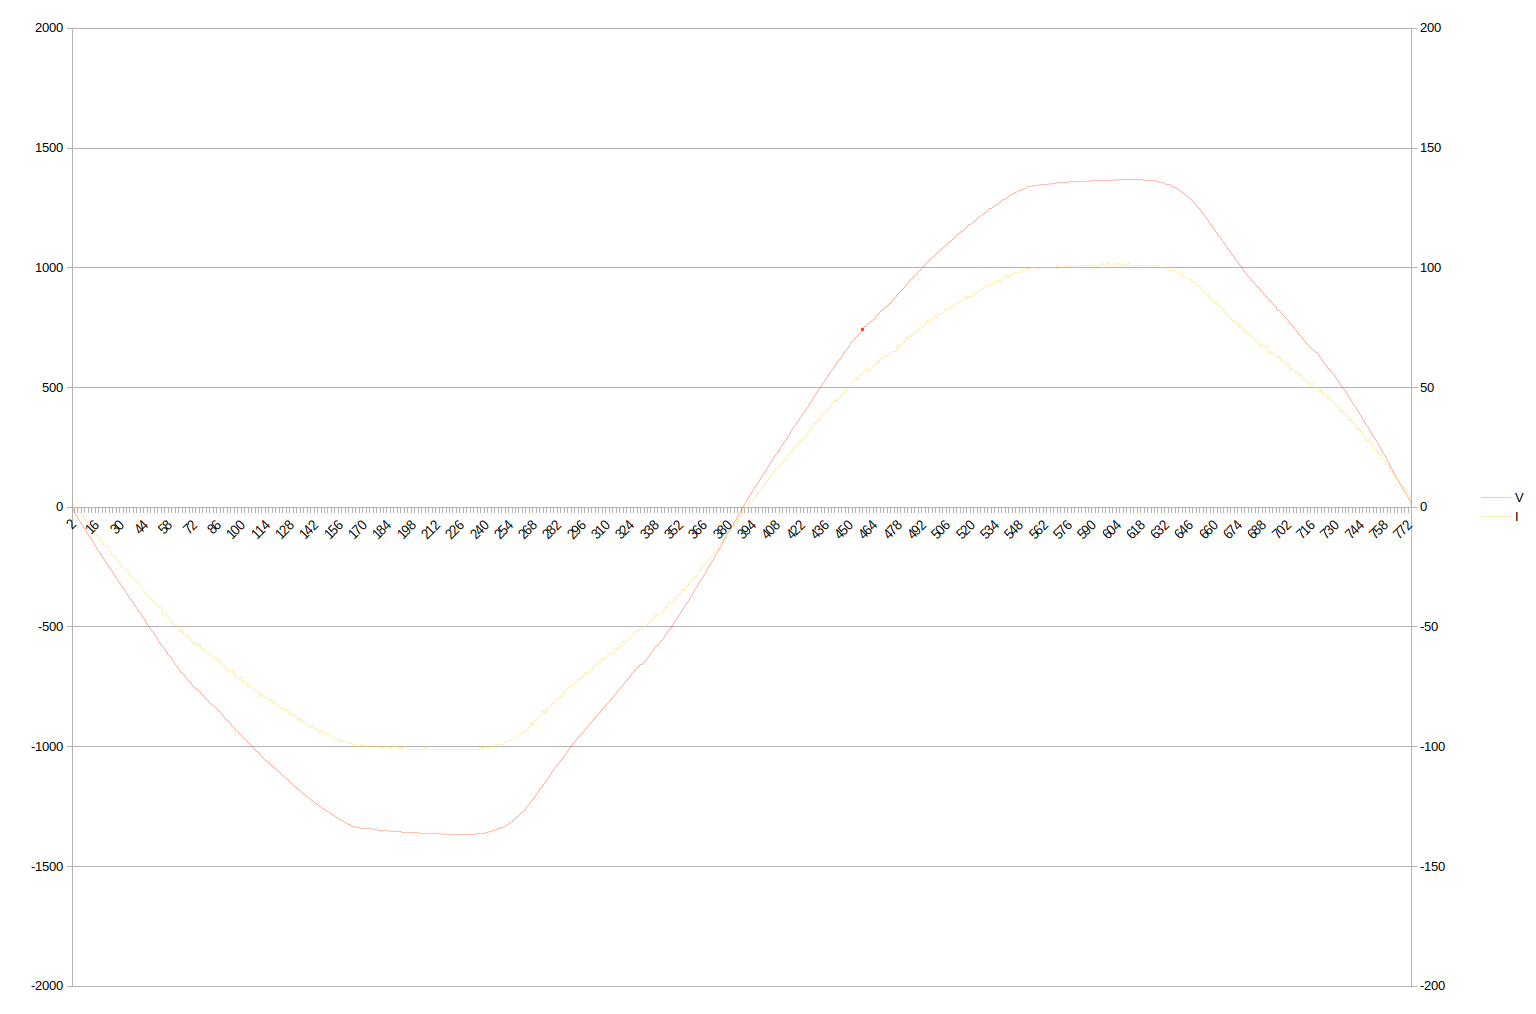
  • Two sin (-ish) waves of voltage and current for the last sample. That is, the ADC readings for the associated VT (channel 0) and a CT (channels 1+).

Outcomes so far:

  • CT channels output have 700 samples. There are values in sampleV which form a sin wave and seem reasonable. There are values in sampleI which at always close to zero. This was unexpected.
  • VT channels output have 700 samples. There are simliar values in both sampleV and sampleI which form a sin wave.

So, the questions:

  • Where/how can I find the last set of sampled I and V waveforms for the last sample?
  • Assuming I get the (integer) ADC values of the VT and CTs, which calibrations/offsets/etc do I apply to get the measured V and I?
  • (Optional for bonus points!): based on the 1s sampling tests, I think I’m just seeing noise, as opposed to true variation in power/voltage. Is this correct?

Regards from Australia,

Brett

FCVHi Bret,

Have you looked at the sample command?

iotawatt.local/command?sample=n

Where n is the desired current channel. Run ‘‘tis in your browser and you will see the output.

The first line states the number of samples, followed by comma separated V,I lines for each sample. The voltage channel is that associated with the current channel. The samples begin and end at the voltage zero crossing.

If you sample in a derived three phase environment, the voltage signal will be the raw VT on phase A and you will need to shift it yourself for phase B and C. Likewise, these are raw samples and do not include any phase correction for The CT and VT as that is applied during calculation of power and never actually applied to the raw sample set.

It would be straightforward to develop an application to display the signals graphically with flot (as used in Graph+). I usually just cut and paste the output to a spreadsheet and use the spreadsheet graph capability to visualize it.

If you want larger numbers for the current, use bigger loads. With a Load equal to the CT capacity, the peaks of the signal would be +/- about 1,750. With a 1 Amp load on a 50Amp CT, the peaks would be 1/50 of that or about 35. That’s with a unity load.

Moving on to your 1s objectives, you have the basic idea that it’s probably not practical with 15 channels (voltage is a channel), but maybe ok with less. It’s better for me at 60 Hz. One significant factor is how much other stuff is going on and how much that extra processing effects the sampling, especially the WiFi interrupt activity which runs at priority and can invalidate a sample. My ESP32 prototype (not even close to ready for prime time) does not suffer from this and samples a rock solid 60 cycles per second, or in your case 50.

Note to other readers: Bret’s detailed notes are a good insight into the internals of IoTaWatt. I have not documented it formally, and so it’s probably a good starting place for those who have forked the project.

1 Like

Thank for your quick, and detailed reply (as always!).

If you want larger numbers for the current, use bigger loads.

Face palm. Ah yes, good point. So the sampleI numbers were ‘right’, just low.

I’ll check out the sample command. I perhaps can implement some option which applies the phase corrections for the CT and VT before output ( iotawatt.local/command?processedsample=n) if I can work that out. btw, thanks for your code comments - most helpful.

Question: When I sampled at 1s intervals (i.e. averaging about 10 cycles per channel), I saw “noise” (see graph in my notes). This wasn’t unexpected (low loads, CT error, ADC convert, etc). However, I’d be really interested to know if you expect this. Do you see this behavior, or is your cycle-to-cycle variation is close to zero for constant loads? In other words, even if we can sample every cycle (ie. at 50Hz/60Hz), do we need to average over 50+ samples (hence back to 1s samples) to smooth the noise? Our key research is trying to dis-aggregate loads on a single CT using 1s or lower sampling. This only would be possible if the 1s readings reflect true load variation. Hope that question makes sense!

I’ve had good experiences with the ESP32. In particular the two cores, esp-idf and FreeRTOS seem good. Good luck.

Cc[quote=“brettbeeson, post:3, topic:1652”]
I perhaps can implement some option which applies the phase corrections for the CT and VT before output ( iotawatt.local/command?processedsample=n ) if I can work that out.
[/quote]

Not sure it matters for what you’re trying to do. I’ll get to this further on, but the phase shift has no effect on RMS Amps or RMS Volts, only Watts. But it is doable, and fairly simple (that phase shift code you glossed over, and I don’t blame you for that. You don’t need to understand it, just replicate it to squirt out the corrected shifted Voltage values. We leave current alone and shift voltage to correct.)

Let’s say I’d expect less obvious excursions with larger loads. My take is that this is not electronic noise, it is digital noise. Let’s be honest, the ESP8266 has a pretty capable CPU, but if you look at the grand scheme of things - sample a cycle (20ms), run services and run the web server for (10ms), go back, Jack, and do it again - you can see there are real limitations. In a perfect world, when the webserver and scheduled services yield in less than 8ms, the best it can do is sample for 67% of the time and everything else using 33% of the time.

Now, if the webserver and scheduled service run over 8ms, even by 1ms, it will cause another half cycle delay - 8ms - before another sample can start.

This all works like clockwork, except there are higher priority events: interrupt handlers. WiFi is probably the most active source of these. I have tried disabling interrupts during sampling, but it causes wdt restarts, even if I feed the damn dog right before disabling.

I believe these interrupts are the most likely cause of the periodic outliers that you see. It’s not possible for the sample code to know directly that an interrupts occurred. Nevertheless, there are several algorithms in the sample loop and subsequent processing code that are designed to try to detect the effects of an interrupt, and to discard the sample.

Statistically, it doesn’t go undetected enough, or introduce enough error, to cause a problem with 5 second intervals.

I don’t know much about the state of the art in this technology. From what I’ve seen, a monitor specifically designed to do this in North America with two mains CTs only has had mixed results. My sense is that even pure 1 second data would be insufficient. When I put a scope on a ct output, the characteristics of each current cycle are far more interesting than 1 second samples for reactive loads. Unity loads pretty much all look alike except maybe for inrush current and amplitude, but once started, they all look alike.

The CVs of the technologists in that other disagregating monitor have backgrounds in speech recognition. I suspect they have a signal processing chip in there and are doing FFT and possibly other analysis on individual cycles. With mixed results.

My take is that this is not electronic noise, it is digital noise

That’s interesting. I think I’ll park this (i.e. <=1s sampling) for now. I can see the ESP32 being an improvement - I guess you can dedicate CPU#2 to sampling. Maybe we can buy an early Esp32 beta board when available. Or maybe an esp32 even ‘drops-in’, pin for pin, to an IotaWatt (although I see my v5 are now soldered and this seems unlikely anyway.) I’ll re-assess 1s samples then as we’ll get most or all the cycles, hopefully without interrupts.

When I put a scope on a ct output, the characteristics of each current cycle are far more interesting than 1 second samples for reactive loads

My thoughts exactly. I saw characteristic signatures and hence the desire to save cycles for later analysis.

The command?sample works easily to get snapshots. Two different loads are below, with current on the RHS.

.

The first plot is interesting in that there appears to be a sawtooth like pattern predominately on the negative half of the cycle of about 2.4kHz. That could be noise (although I don’t believe significant enough to cause the outliers in your 1s experiments), or it could be a characteristic of your load. They otherwise look like resistive loads, but could there be a low rpm motor in there?

1 Like

Nice guess! Yes, that first one is a hot-air gun with a small (5W?) motor and a big resistance. The other is a pure electric heater with a big resistance. This was a first pass at “can I spot the difference between two appliances?” based on one cycle.