When I plot Watts,
I get what I would expect.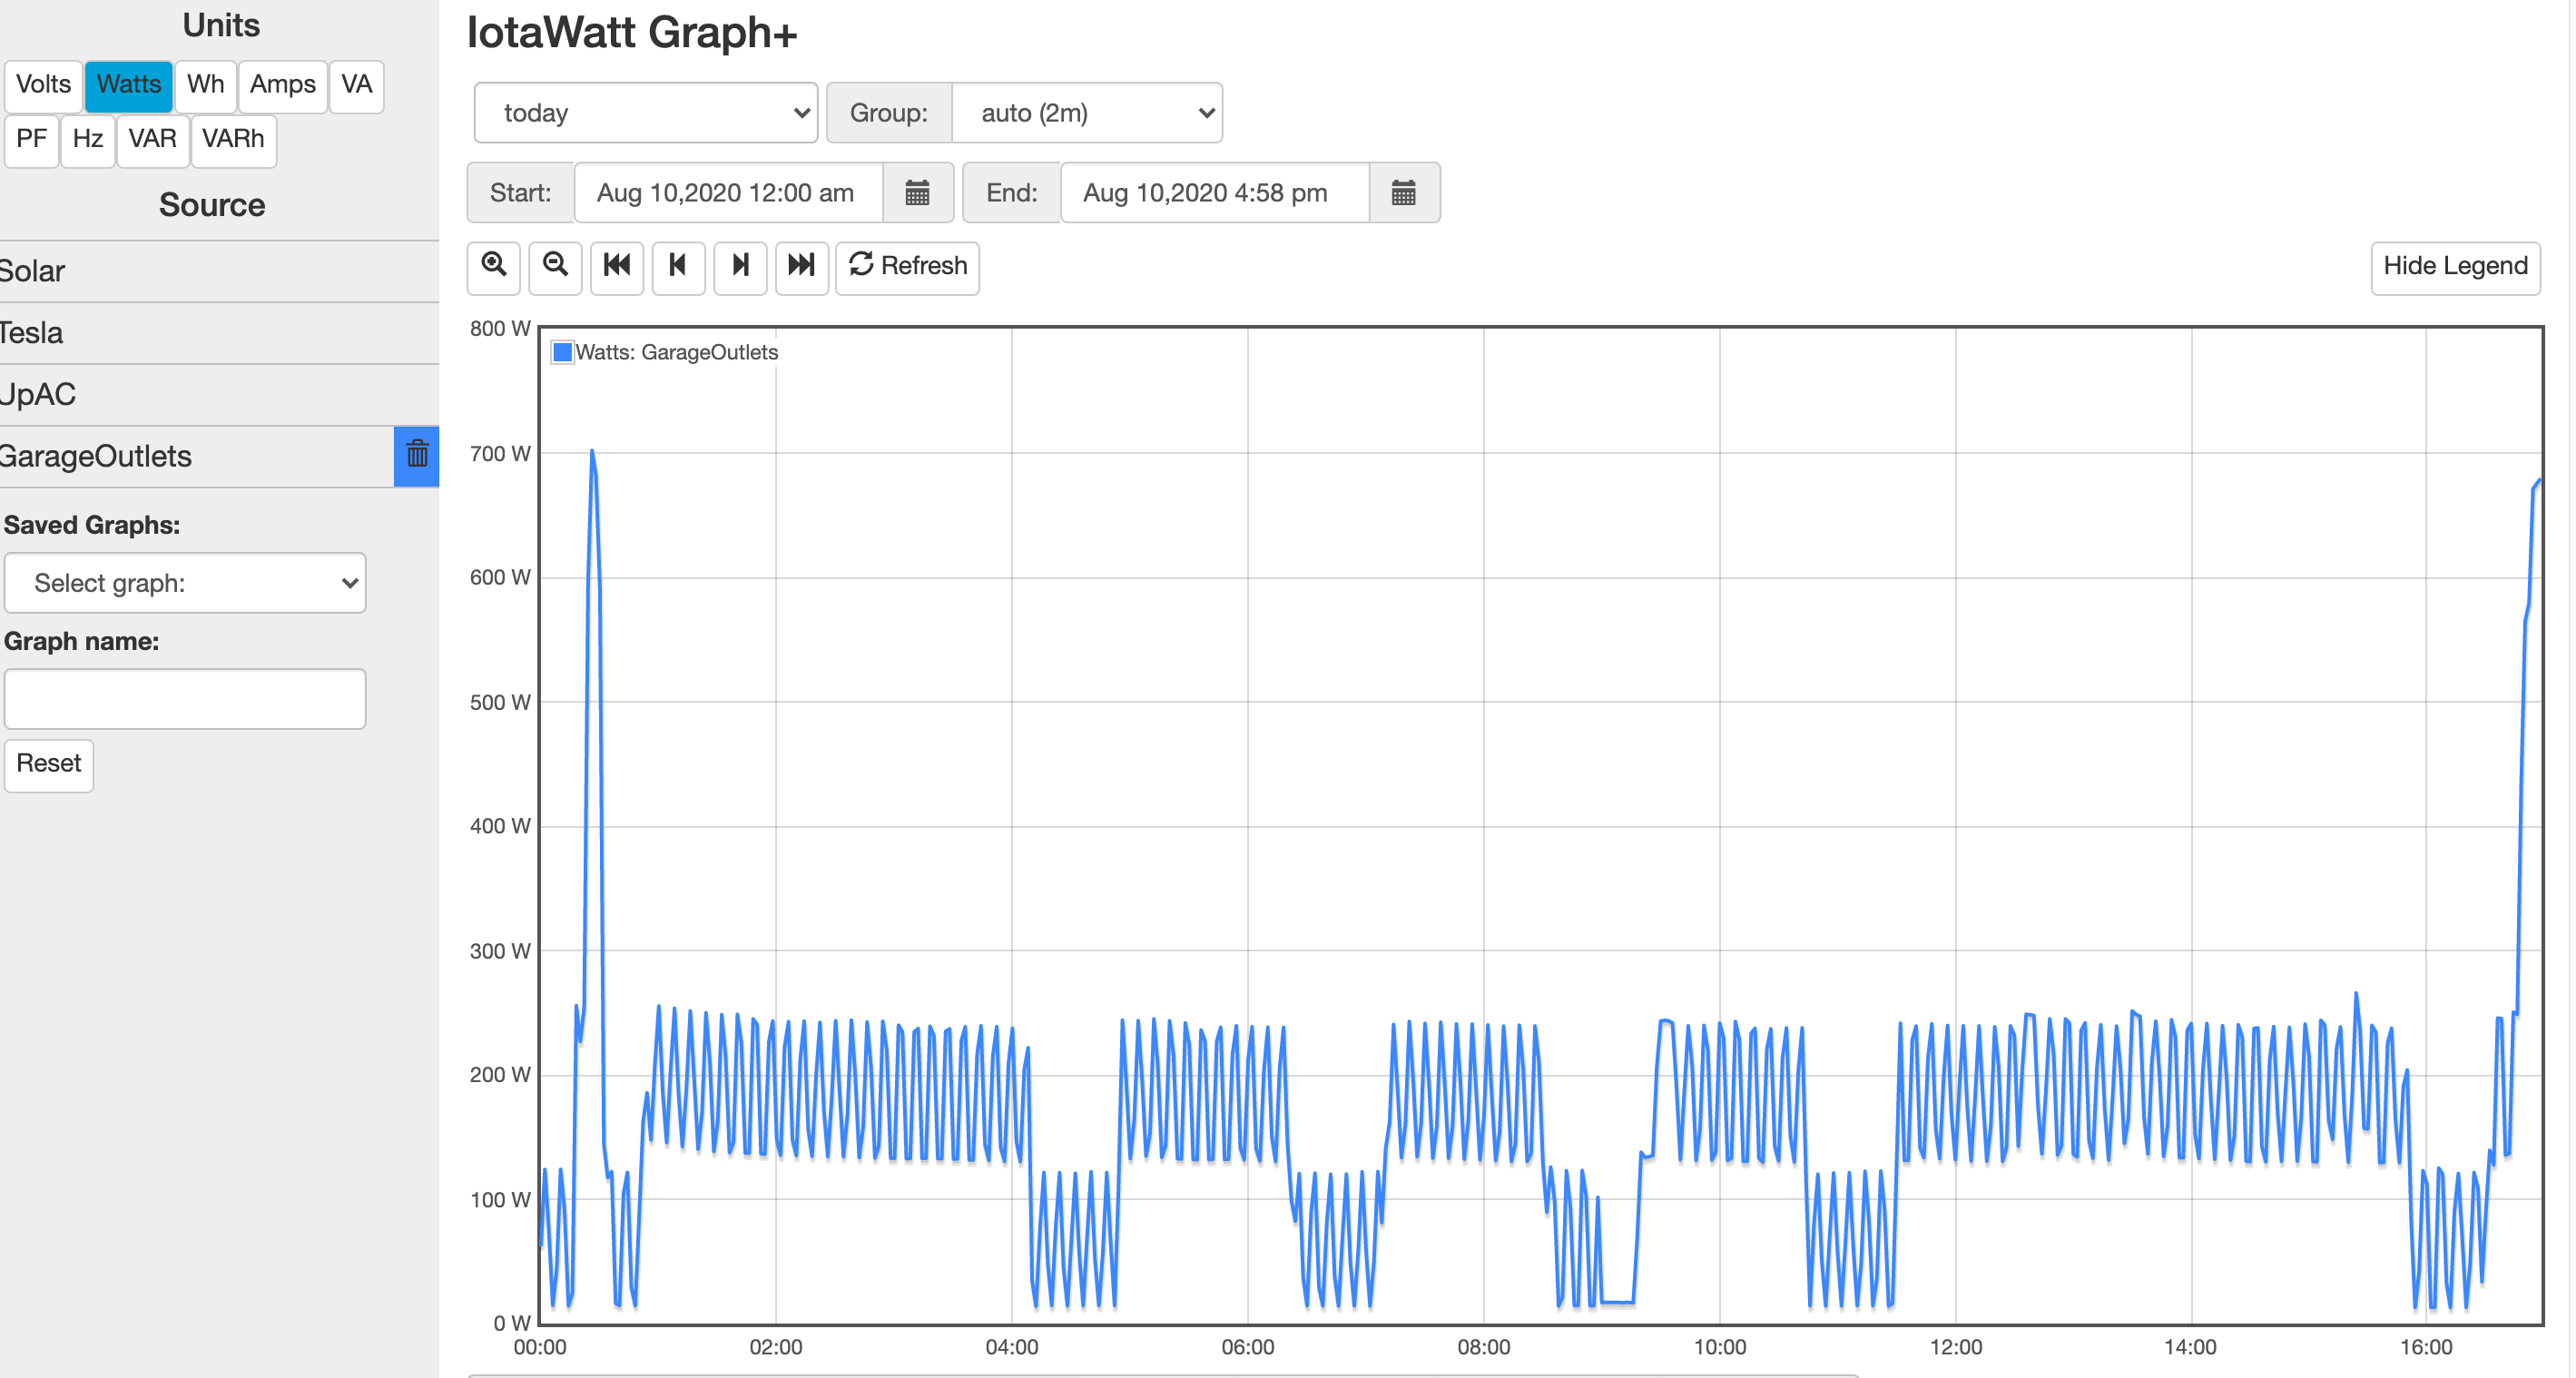
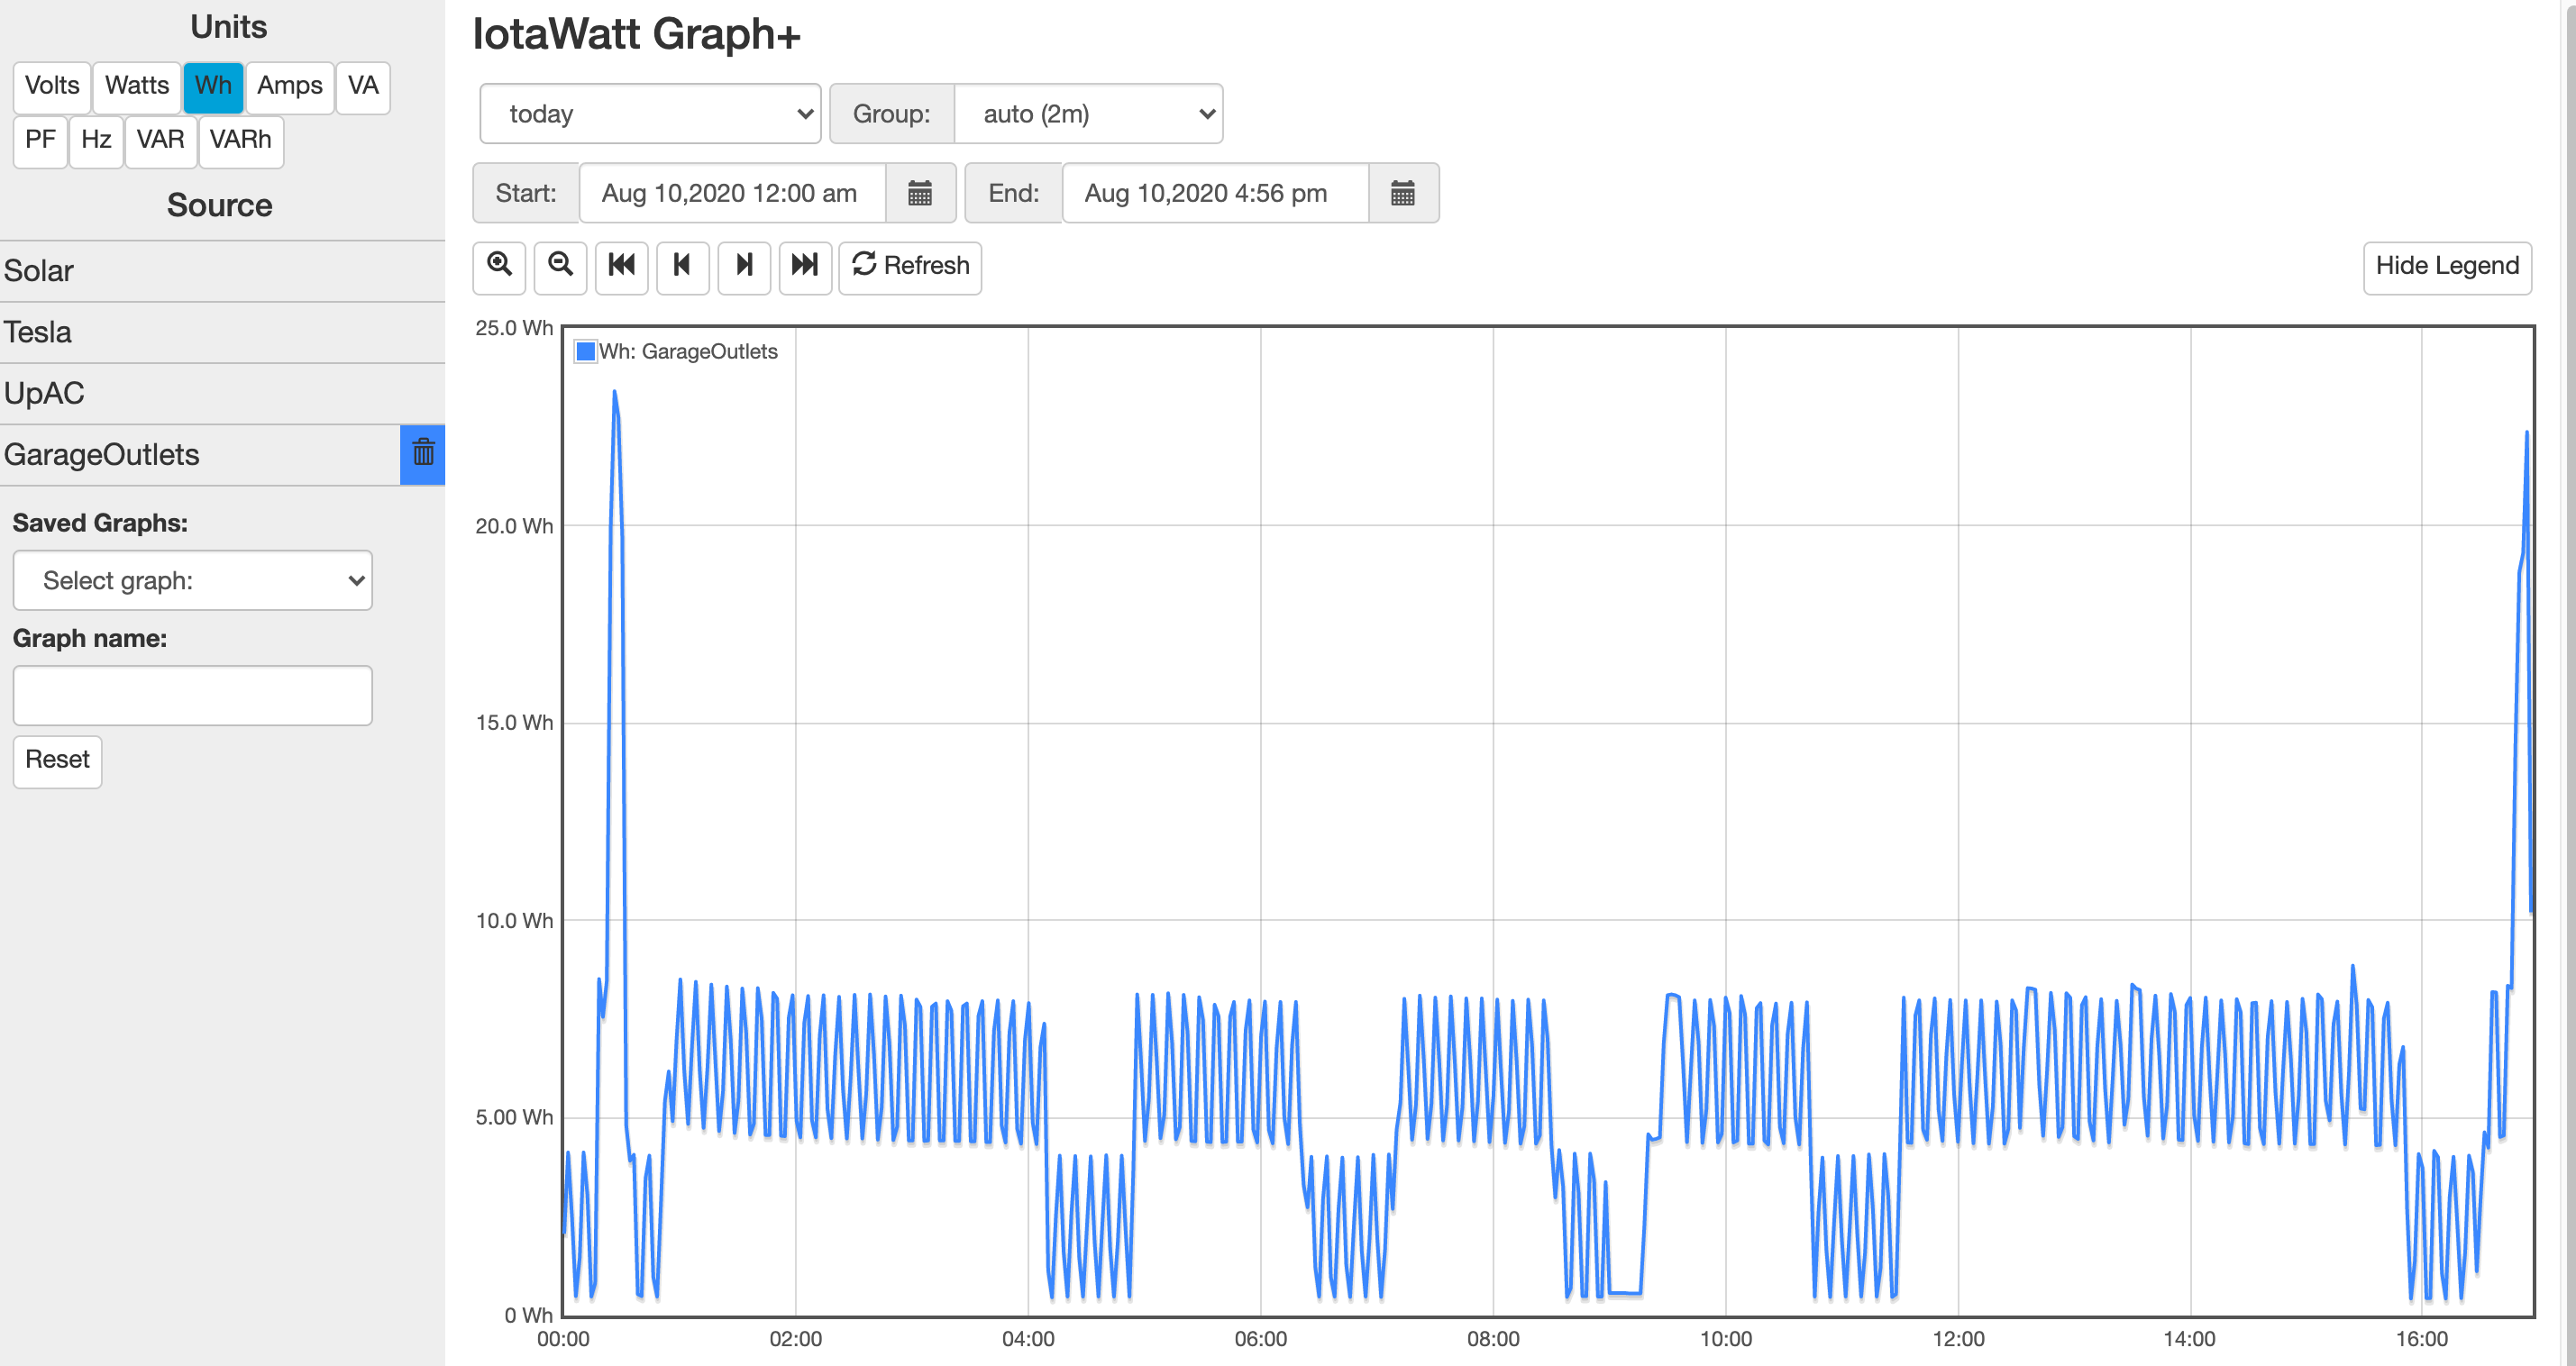
However when I plot Wh which I would have thought was Watt-hours, I get the same plot, but with different units.
When I plot Watts,
I get what I would expect.However when I plot Wh which I would have thought was Watt-hours, I get the same plot, but with different units.
It’s tricky. Watts are the watts used during the intervals of the plot. In your example 2 minutes or 60 seconds or 2/60=0.0333 hours. So an average 200W for 0.0333 hours would be 6.66Wh. That explains the difference in units.
With fixed intervals, average Watts and Wh are the same measurement with different units. For small intervals, Watts are interesting. For longer intervals, Wh are interesting. In your example, you can see that GarageOutlet load varying by 100W 7-8 times per hour. If you changed the grouping to hourly on the Wh plot and set it to bars, you would see the kWh used each hour without the noise of the constant cycling.
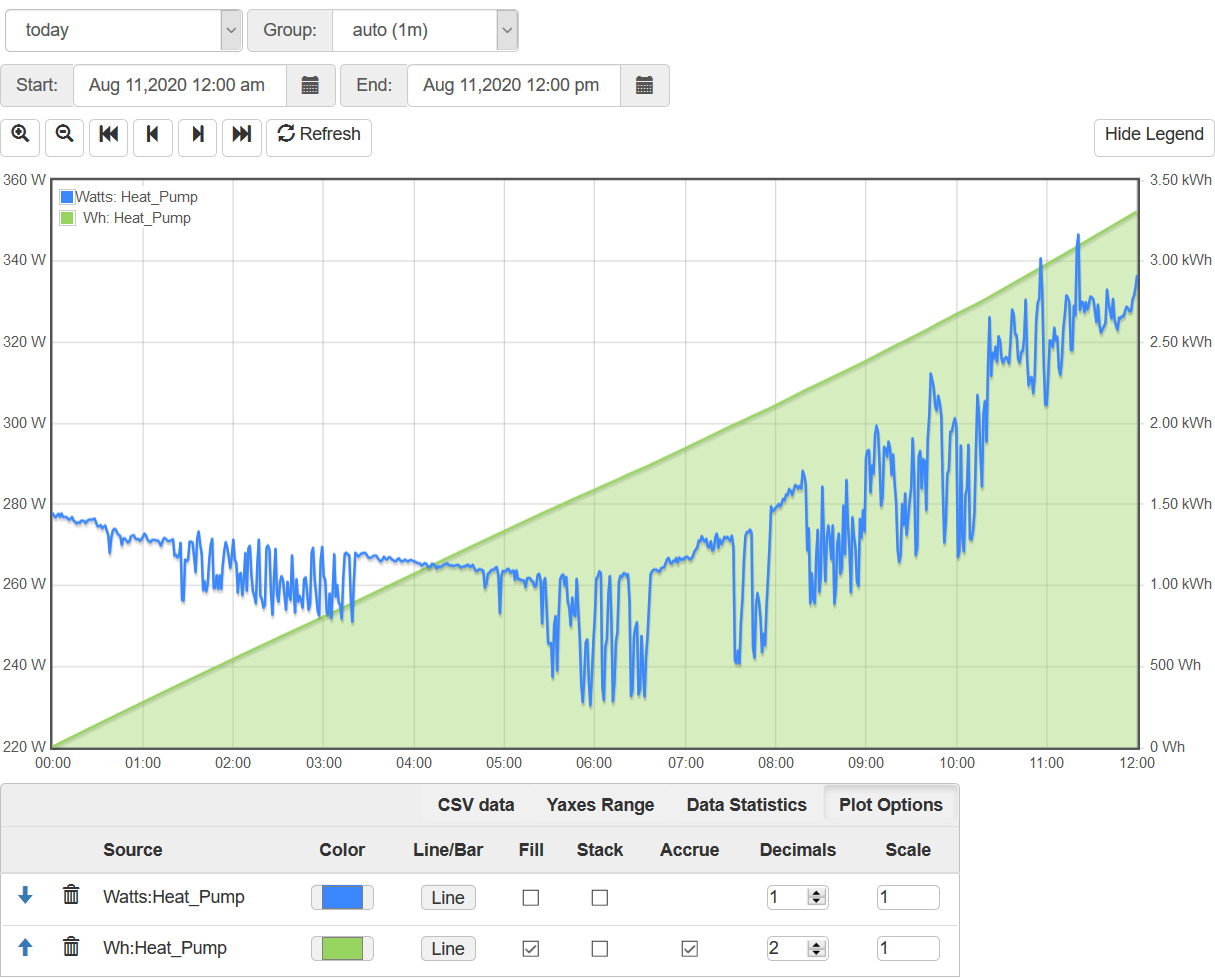
If you want to see the Wh used cumulatively, you can click the “accrue” plot option as I have done here for my heatpump today.
Wh is also good for looking at your historical usage. Here’s my house last week with daily kWh used:
Thank you Overeasy for the explanation and demo. That will be very useful.