Hi,
I can’t open iotawatt.local/ correctely. I have try with: IPAD +safari no works; IPAD+chrome no works; Mac +chrome no works, windows 10 + explorer no works.
any ideas ?
tku
I’d stick with iPad safari. That works rock solid for me. Make sure:
-
You have first configured your IoTaWatt to connect to a WiFi network, and the LED is a dull green.
-
Your iPad is connected to the same WiFi network.
-
If you have changed the name of your IoTaWatt (in the device section of the config app) then you must use the newname.local.
If that doesn’t help and you are able to check the DHCP assignments of your router to determine the IP address assigned to your device, try connecting to that (http://192.168.1.n typically).
Fixed ! IPAD+SAFARI it’s work! I reset naviagator safari.
I find it strange that I can’t look at any of the graphing capabilities of the Iotawatt when using Chrome (Version 67.0.3396.87 64 Bit) but can do so when using Safari Version 9.1.3 (9537.86.7.8). I’m on a somewhat ancient Mac that is way out of date with OS 10.9.5.
Chrome Version 71.0.3578.98 (Official Build) (64-bit) works on Windows 10. Also Edge, IE, and Firefox. You may need to use http://iotawatt.local or in the worst case use the IP address.
I can successfully load the iotawatt.local address, change all the settings, et al, and click over into the “graphs” page, but none of the functionality on said graphs page works. It’s really not a big deal (when I need to look at a graph I just load up Safari) but thought I’d point it out here in case anyone else was finding this to be an issue. There is absolutely no need to attempt to make something work for a person like me who refuses to upgrade to a newer OS since I’m on a dinosaur machine that I don’t want to pay to replace.
graphs work OK on my version, but I’d like to know what IoTaWatt release you are using, because I recently changed it to fetch JQuerry and Flot from a CDN rather than the emoncms site. Given that the graph.js page uses some older versions of those components, I had to hunt for the right ones to produce the desired results.
If you activate the JS debugger (F12) while loading graph, it should log problems under the “console” tab.
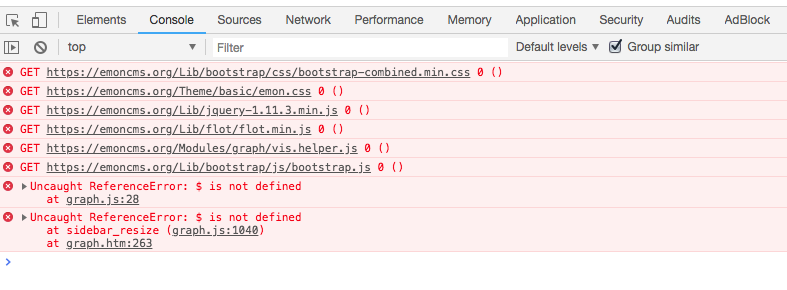
That release predates the change to CDN so that’s not it. Don’t know what these errors are, but if it’s running on a current browser, I’d probably pass on researching it.
Don’t trouble yourself with it. I just thought I’d post in case others were researching. There are far better things for you to spend your time improving.
1 Like