Hi there.
I’m a bit puzzled with the values returned when I query the iotawatt
I have various sensors (13 in total) for all circuits as well as two solar feed.
Solar feed reads negative, all the other positive.
I have one output defined as:
Phase1 + Phase2 + Phase3 + Tesla1 + Tesla2 + Tesla3 + Pool + Solar1 + Solar2 + AC1 + AC2 + AC3 + HotWater min 0
If I query the individual value for Wh I will read:
http://iotawatt.local/query?select=[time.utc,Export.wh]&begin=2021-08-18&end=2021-08-19&format=csv&group=m
2021-08-18T00:33:00, 0
2021-08-18T00:34:00, -1
2021-08-18T00:35:00, -2
2021-08-18T00:36:00, -1
2021-08-18T00:37:00, -2
2021-08-18T00:38:00, -2
2021-08-18T00:39:00, -5
2021-08-18T00:40:00, -5
2021-08-18T00:41:00, -5
2021-08-18T00:42:00, -5
2021-08-18T00:43:00, -6
2021-08-18T00:44:00, -5
2021-08-18T00:45:00, -6
2021-08-18T00:46:00, -10
2021-08-18T00:47:00, 0
2021-08-18T00:48:00, -8
2021-08-18T00:49:00, -9
2021-08-18T00:50:00, -11
2021-08-18T00:51:00, -18
2021-08-18T00:52:00, -12
etc…
however, when I query the cumulative value since the beginning of the year:
http://192.168.10.3/query?select=[time.iso,Export.wh]&begin=y&end=s&group=all
it will read:
0
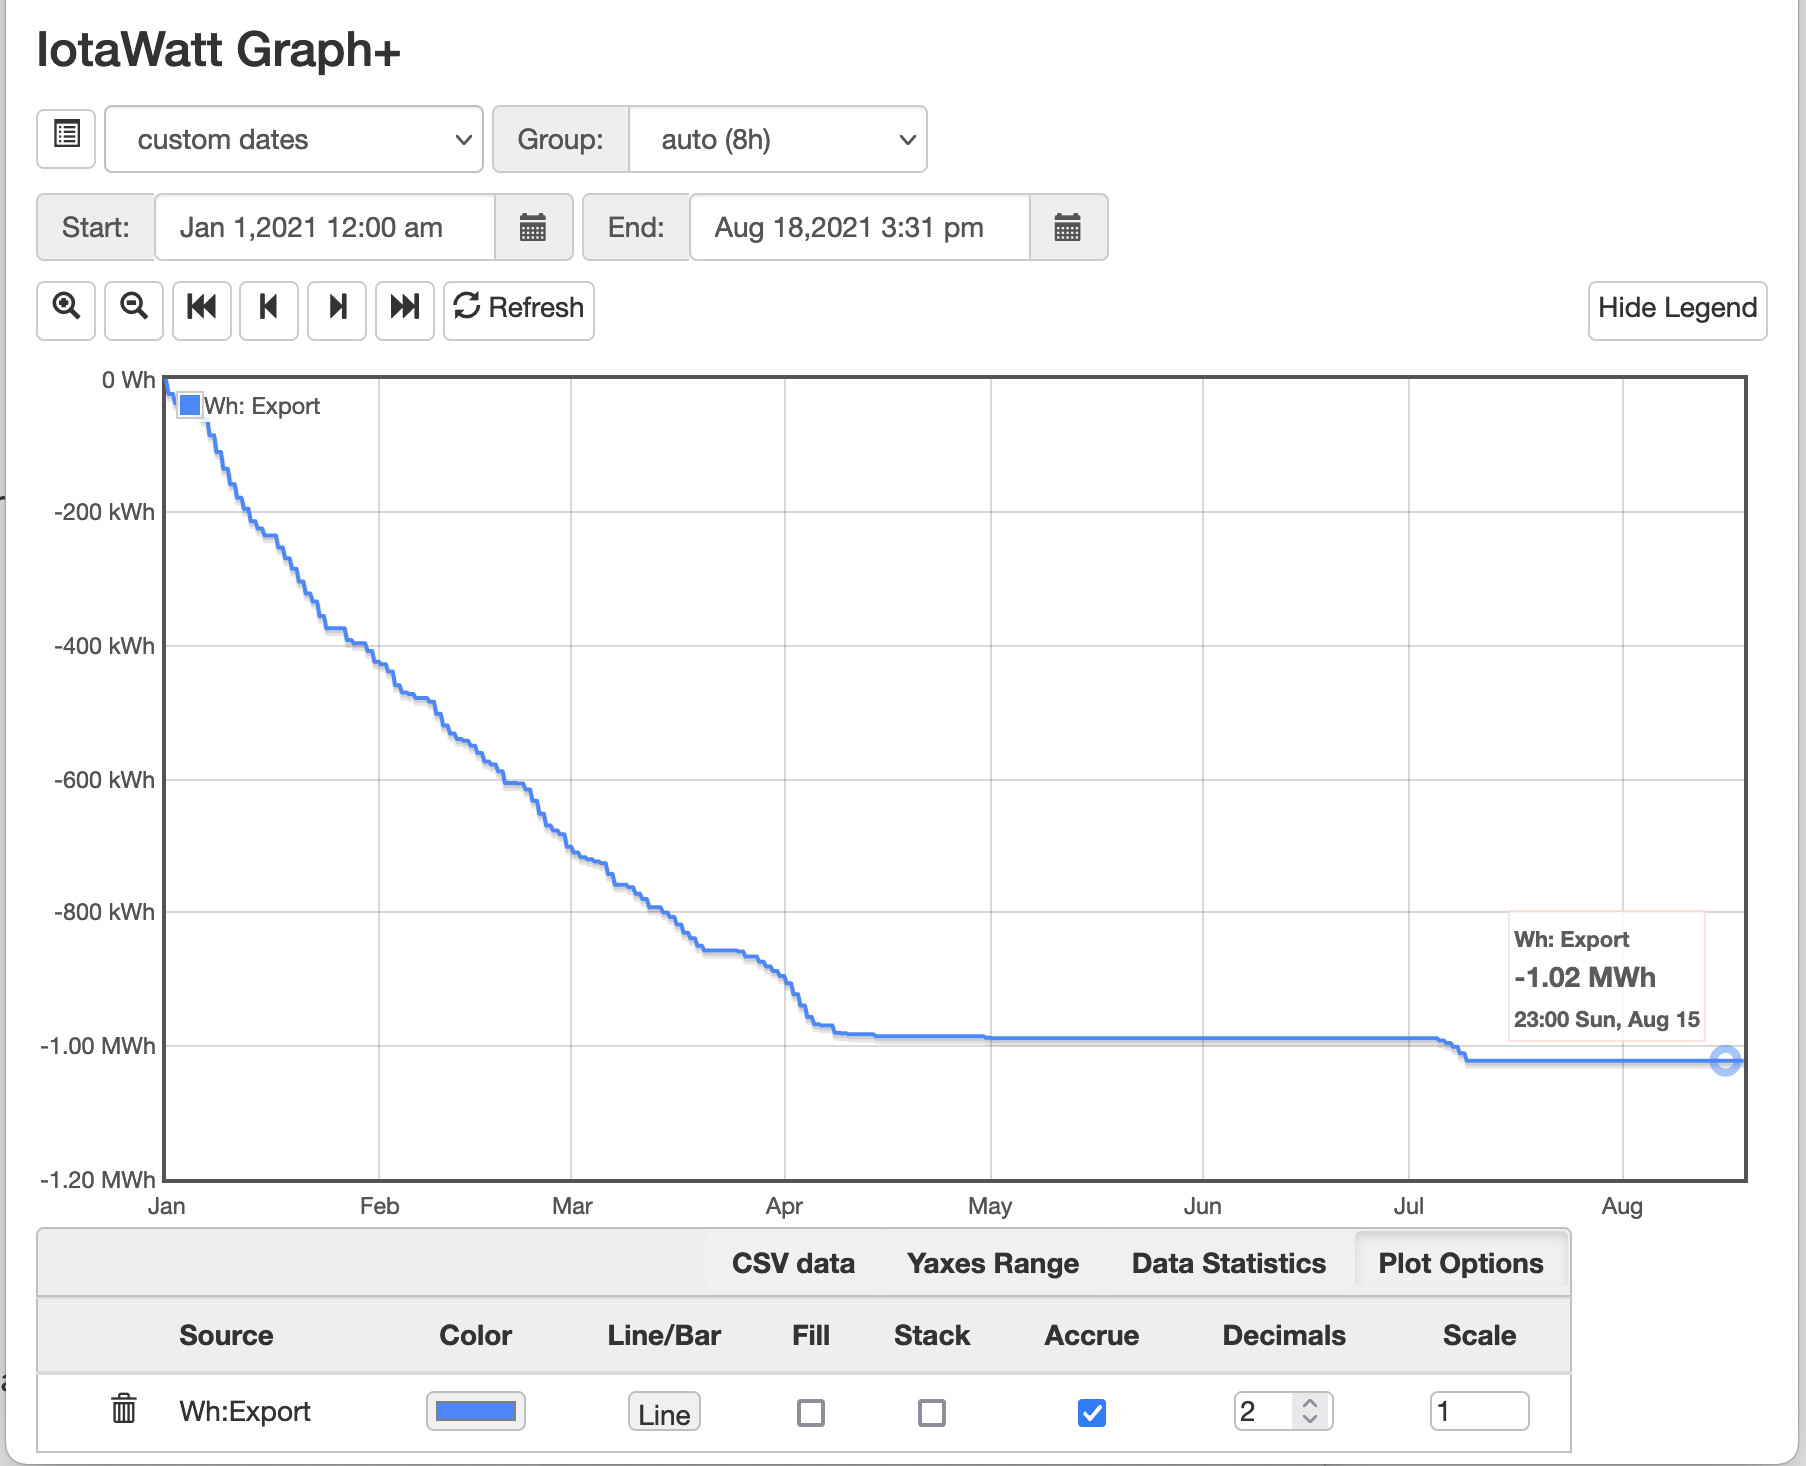
Using Graph+ it will plot things properly. There’s definitely proper data in there, since the beginning of the year.
But I just can’t retrieve the value via REST
Any ideas?
thanks
JY
