It is confusing because there are MANY ways to do things. I don’t have an answer for you since I haven’t done it for iotawatt yet.
I have used emoncms for some time now and it is pretty capable, but doesn’t do some simple things well, ie show you what is happening now or for the last little while.
Grafana does a really good job of displaying just about anything you want, but is complicated and/or tedious to set up. It has great ability to show various time periods, including the last little bit of time.
I am standardizing on Grafana. It has different ways that it can work. It can work with individual measurements or it can do things that are more templated. If you are willing to spend the time to configure every graph/component in Grafana, it is less critical how you set things up.
One thing to keep in mind is that doing math across measurements is not possible/easy with influxdb (as far as I know). This means that you really need to think about what you want to be able to visualize and then you can figure out what data you need to get that.
As an example, I want to see the following:
- Voltage over time
- Power over time for each circuit
- Energy over time for each circuit
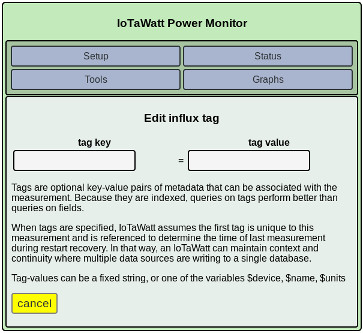
That is the very basic use case. Now if I want them in individual graphs there are a couple of ways to set up the data. Using templating, I can create a definition that gets all/many with a single Grafana measurement. The problem with that is the labels don’t look great, too long. But, doing it without templates, while allowing nice names for each line, takes some time to configure.
Read up on templates fof Grafana and figure out what you want your dashboard to look like, then you will have some idea of what data you need to store in influxdb, which will give you insight into what you need to configure in iotawatt.
I believe several people have been using influxdb for some time and maybe they would share what they chose and why.
I use Grafana to keep track of my compost pile. I first used tags to keep track of each sensor, with a templated query to display the results with one measurement definition in Grafana. It works fine.
I then added the same sensors to OpenHAB and it also has an influxdb persistent store. But, it stores each data point in a unique measurement. I then created a new graph to display the results. But, this time I had to create a measurement/line for each sensor. This both good and bad. The good part is that I can configure everything and get nice names for each line. The bad part is that I have to do it for each one. So, both work. Since you don’t have to use templated queries, having tags that allow you to do so is a good thing. Influxdb is smart about the data that it stores, so I don’t believe there is a large cost to having several tags for each data point. Having them allows you to combine data from multiple measurements (this sounds like a contradiction of my statement about multiple measurements, but that was about more complex math than summation/average). When I set it up, I will probably use a rich tag set, so I can see utilization across meaningful multiples of circuits easily, like all first floor, all kitchen, all laundry, all second floor, all bedrooms. The choices that make sense depend on the way the circuits are laid out.
Hope that helps.


