Yes, the graph is there with data.
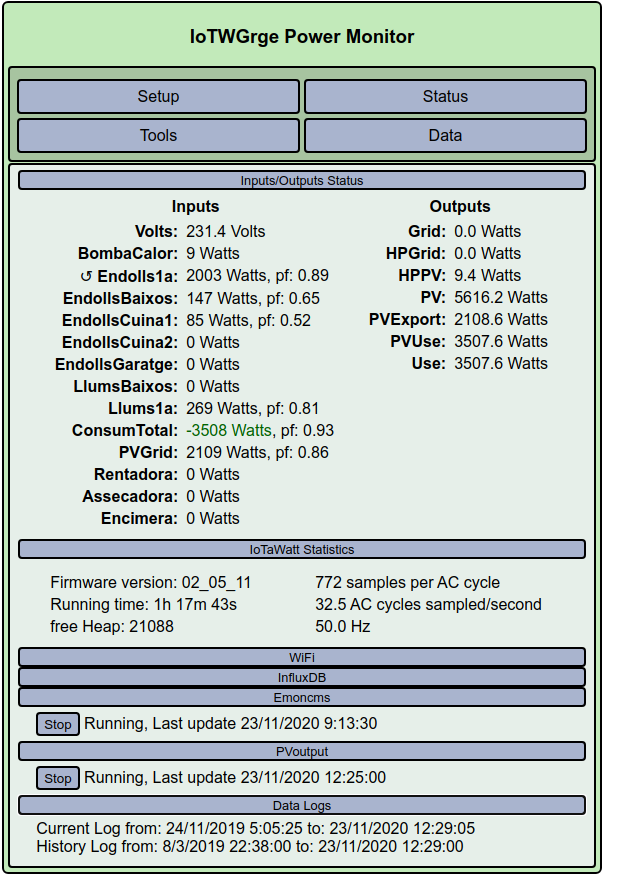
Note that you’ll see some nulls, but aren’t because there is no data: Since I had to stop/start for each batch load, I changed the interval to 120 secs, and went back to 10s when I was close to current time. With 120secs I was able to load around 40 mins, while with 10s, only 4 mins.
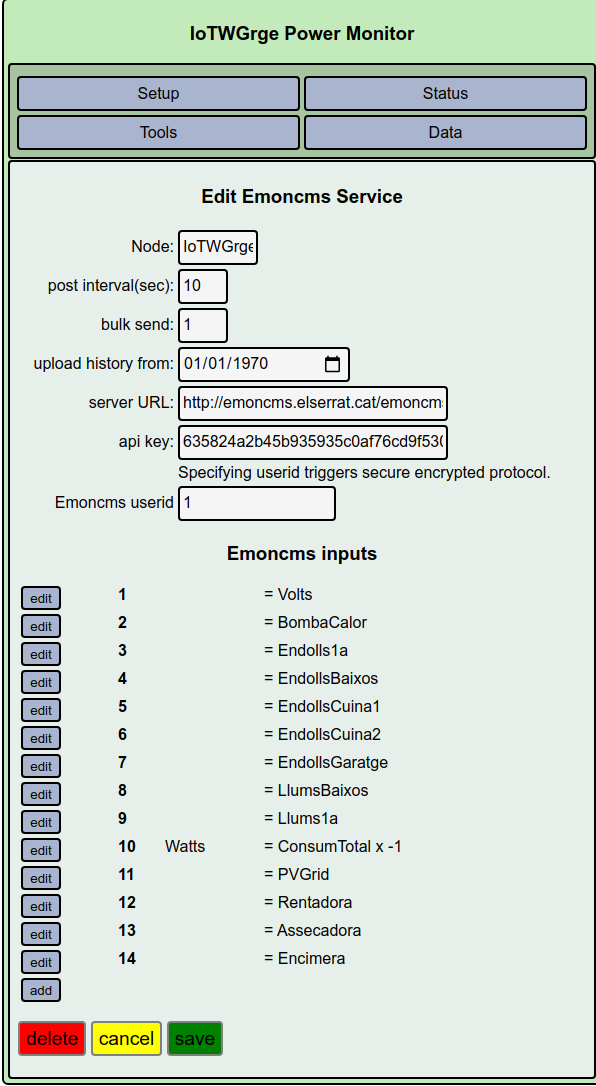
Now the interval is 10s.
Below the csv for the graph:
“Unix timestamp”, “IoTWGrge:VoltsIoTGaratge”, “IoTWGrge:import”
1606326180, null, null
1606326190, null, null
1606326200, null, null
1606326210, null, null
1606326220, null, null
1606326230, null, null
1606326240, 221.8, 1246.1
1606326250, null, null
1606326260, null, null
1606326270, null, null
1606326280, null, null
1606326290, null, null
1606326300, null, null
1606326310, null, null
1606326320, null, null
1606326330, null, null
1606326340, null, null
1606326350, null, null
1606326360, 223.1, 1188.3
1606326370, null, null
1606326380, null, null
1606326390, null, null
1606326400, null, null
1606326410, null, null
1606326420, null, null
1606326430, null, null
1606326440, null, null
1606326450, null, null
1606326460, null, null
1606326470, null, null
1606326480, 222.1, 1171.0
1606326490, 222.0, 1180.5
1606326500, 220.6, 1164.3
1606326510, 220.6, 1168.0
1606326520, 220.9, 1159.1
1606326530, 222.1, 1156.0
1606326540, 221.9, 1159.2
1606326550, 221.9, 1199.3
1606326560, 222.3, 1192.1
1606326570, 221.0, 1224.4
1606326580, 220.8, 1264.2
1606326590, 220.7, 1269.0
1606326600, 221.4, 1257.8
1606326610, 222.6, 1290.9
1606326620, 222.4, 1277.4
1606326630, 222.4, 1261.2
1606326640, 221.7, 1258.0
1606326650, 221.4, 1262.0
1606326660, 222.3, 1256.0
1606326670, 221.6, 1266.4
1606326680, 221.4, 1259.7
1606326690, 221.8, 1244.3
1606326700, 221.9, 1245.9
1606326710, 221.8, 1229.8
1606326720, 221.8, 1236.0
1606326730, 221.2, 1272.6
1606326740, 220.9, 1258.7
1606326750, 221.1, 1221.7
1606326760, 220.9, 1229.8
1606326770, 221.4, 1229.2
1606326780, 221.7, 1233.2
1606326790, 221.5, 1252.6
1606326800, 221.8, 1281.6
1606326810, 222.4, 1232.1