View the raw data, drop the columns that don’t match, and join the two tables. Your queries can remain as-is, just both in a single cell. It doesn’t work when there is data that doesn’t match between the two tables, which is why you have to strip out that information.
1 Like
I knew that a join was likely in my future. Here are the two tables with raw data -
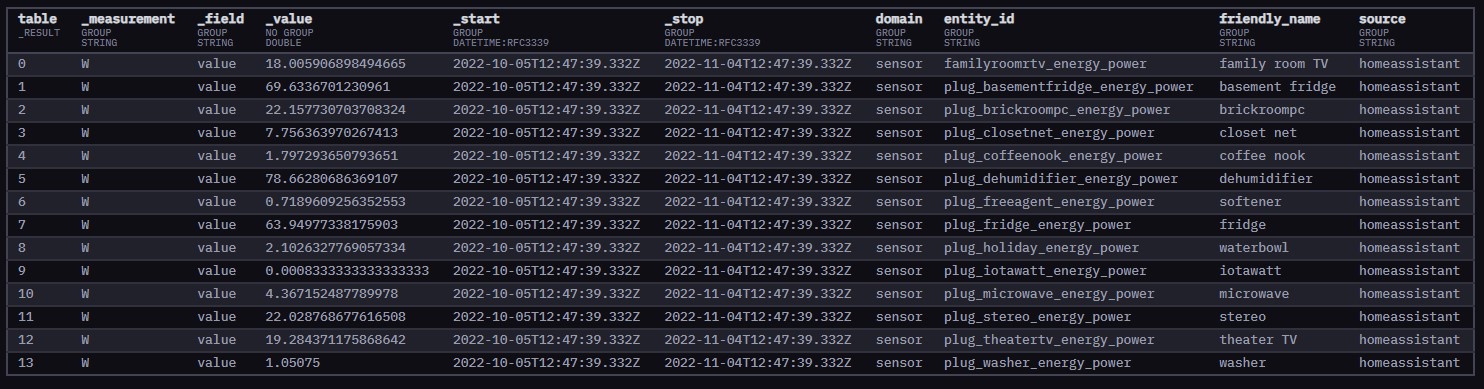
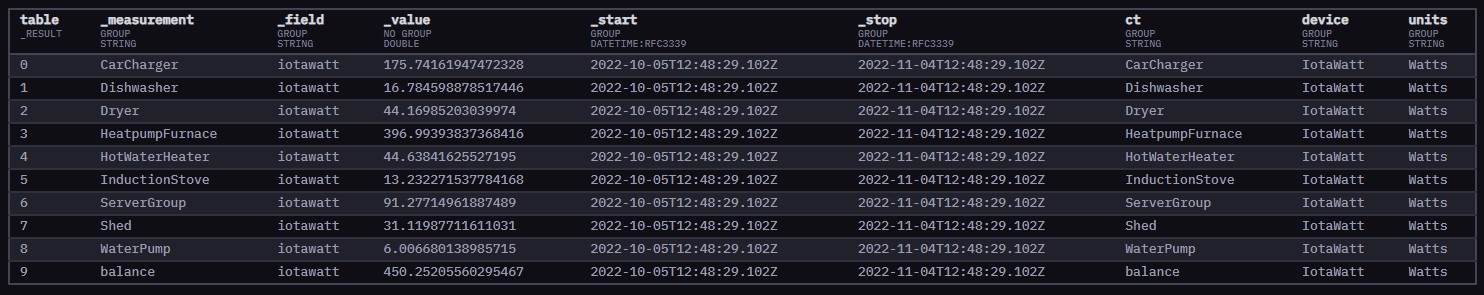
I will do some googling here for Drop/Join - but any help would be appreciated.
Thanks
Ok, that is going to take a little more work since your column names are inconsistent, but not a huge issue. If you are ok with pseudocode, the concept is for IoTaWatt you want to first change the “from” to this:
iotawatt = from(bucket: “iotawatt”)
then add this at the end:
|> keep(columns: ["ct", "_value"])
For the plugs, change “from” to this:
plugs = from(bucket: “iotawatt”)
then you want to add this at the end:
|> keep(columns: ["friendly_name", "_value"])
|> rename(columns: {friendly_name, "ct"})
union(tables: [iotawatt , plugs])
keep and union are easier to work with for your specific data than drop and join.
ok - fiddled around and I think I got it. Here is the code so far -
plugs = from(bucket: “iotawatt”)
|> range(start: v.timeRangeStart, stop: v.timeRangeStop)
|> filter(fn: (r) => r[“friendly_name”] == “stereo” or r[“friendly_name”] == “theater TV” or r[“friendly_name”] == “washer” or r[“friendly_name”] == “waterbowl” or r[“friendly_name”] == “softener” or r[“friendly_name”] == “microwave” or r[“friendly_name”] == “iotawatt” or r[“friendly_name”] == “fridge” or r[“friendly_name”] == “family room TV” or r[“friendly_name”] == “dehumidifier” or r[“friendly_name”] == “coffee nook” or r[“friendly_name”] == “closet net” or r[“friendly_name”] == “brickroompc” or r[“friendly_name”] == “basement fridge”)
|> filter(fn: (r) => r[“_field”] == “value”)
|> aggregateWindow(every: v.windowPeriod, fn: mean, createEmpty: false)
|> integral(unit: 1000h, column: “_value”)
|> keep(columns: [“friendly_name”, “_value”])
|> rename(columns: {friendly_name: “ct”})iotawatt = from(bucket: “iotawatt”)
|> range(start: v.timeRangeStart, stop: v.timeRangeStop)
|> filter(fn: (r) => r[“_measurement”] == “CarCharger” or r[“_measurement”] == “Dishwasher” or r[“_measurement”] == “Dryer” or r[“_measurement”] == “HeatpumpFurnace” or r[“_measurement”] == “HotWaterHeater” or r[“_measurement”] == “InductionStove” or r[“_measurement”] == “ServerGroup” or r[“_measurement”] == “Shed” or r[“_measurement”] == “WaterPump” or r[“_measurement”] == “balance”)
|> aggregateWindow(every: v.windowPeriod, fn: mean, createEmpty: false)
|> integral(unit: 1000h, column: “_value”)
|> keep(columns: [“ct”, “_value”])union(tables: [plugs , iotawatt])
One thing that needed changed from the code @Tjootjim provided -
The rename command needed a : after the current name
|> rename(columns: {friendly_name: “ct”})
Flux can be frustrating. Something as simple as a sort command has taken me a couple of hours of googling and experimenting and nothing seems to work for me.
Here is the expression I have tried that should work - but does nothing.
|> sort(columns: [“_value”], desc: false)
I’ve tried putting it before and after the ‘union’ command - as well as several other locations in the code.
Any ideas where this should go? Or why it isn’t working?
No luck with sort or actually setting the sort-on column. There is a lot of information that should be exposed to configuration in Flux that simply isn’t. Grafana seems to do a little bit better job.
Hi @wallacebrf , Thanks for posting your work here. I’m trying to get me head around flux and struggling to be honest ![]()
I’m trying to use your string manipulation to get a time range for this month and graph my daily consumption.
The query I have so far is:
import "strings"

month = time(v: "${strings.substring(v: string(v: now()), start: 0, end: 8)}01T00:00:00Z")

// Query to grab Watt hours from db
from(bucket: "iotawatt")
 |> range(start: month, stop: now())
 |> filter(fn: (r) => r["_measurement"] == "import_energy")
 |> filter(fn: (r) => r["_field"] == "value")
// sum the values by day.
 |> aggregateWindow(every: 1d, fn: sum)
// give the counter a friendly name.
 |> map(fn: (r) => ({_value: r._value, _time: r._time, _field: "Import Wh"}))
 |> yield(name: "mean")
The query works but isn’t using the range set in the query. It’s using whatever I set in the Grafana GUI.
I have it working for the month by using the line
range(start: v.timeRangeStart, stop: v.timeRangeStop)
and setting the range to this month.
I can’t for the life of me see why it doesn’t pick up the correct start and end times from the code above.
Have I missed something obvious?
for the sorting, i use grafana
i think you might not be pivoting the table?
|> pivot(rowKey: [“_time”], columnKey: [“_field”], valueColumn: “_value”)
i do not think (but cannot recall 100%) if this is needed only when requesting more than one field. you are only pulling one field.
you should also not need the last map command if you just want to rename the columns you can directly rename them using
|> keep(columns: [“_value”, “_time”])
|> rename(columns: {_value: “Import Wh”, _time: “Date”})
i will have to try some things at home when i am not working to see if i can figure out what is going on.
when you are inside InfluxDB directly, and tell it your command, what do you see when you click the “RAW Data” toggle button?
How do you know InfluxDB/Flux isn’t picking up the right range?
Pretty sure Grafana only displays what you tell it the range is. When I want something monthly, I tell Grafana to use that for that specific panel, so I can still change the date range for the others. I then use time range variables for the query. I have one that shows me the same measurement for the last 7 days overlayed by using some Flux magic.
i know it is pulling the data i want due to the “|> range(start: month, stop: now())” it is only going to pull the range of data commanded.
Perhaps I misunderstood your question?
here is the code i use to display daily consumption used total
import "strings"

month = time(v: "${strings.substring(v: string(v: now()), start: 0, end: 8)}01T00:00:00Z")

from(bucket: "home_energy")
|> range(start: month, stop: now())
|> filter(fn: (r) => r._field == "Mains1_W" or r._field == "Mains2_W")
  |> filter(fn: (r) => r["_measurement"] == "house_power2")
|> pivot(rowKey: ["_time"], columnKey: ["_field"], valueColumn: "_value")
|> map(fn: (r) => ({ r with _value: r.Mains1_W + r.Mains2_W }))
|> aggregateWindow(
    every: 1d,
    fn: (tables=<-, column) =>
      tables
        |> integral(unit: 1h)
        |> map(fn: (r) => ({ r with _value: r._value / 1000.0})))
|> keep(columns: ["_value", "_time"])
|> rename(columns: {_value: "Total Energy Uage Per Day", _time: "Date"})
you should not need the line
|> map(fn: (r) => ({ r with _value: r.Mains1_W + r.Mains2_W }))
as i only use that to add my two main phases together. you appear to have a total power draw in the import_energy measurement?
my code will return the number of kilo-watt hours used each day for only the current month.
the code just uses the raw wattage values saved (for me every 15 seconds) from the IoTaWatt and does not need to perform a summing action as it instead performs an integral to get the “area under the curve” to get the actual power over time.
hopefully this will help you.
i also have the hourly energy usage for the day
from(bucket: "home_energy")
|> range(start: v.timeRangeStart, stop: v.timeRangeStop)
  |> filter(fn: (r) => r["_measurement"] == "house_power2")
  |> filter(fn: (r) => r["_field"] == "Breaker_2_W")
  |> filter(fn: (r) => r["tag1"] == "iotawatt.01")
|> aggregateWindow(
    every: 1h,
    fn: (tables=<-, column) =>
      tables
        |> integral(unit: 1h)
        |> map(fn: (r) => ({ r with _value: r._value / 1000.0})))
|> keep(columns: ["_value", "_time"])
|> rename(columns: {_value: "Breaker 2 Total Energy", _time: "Date"})
finally i also have my code for the monthly usage for the last 2 years
import "date"

start_date = date.truncate(t: -2y, unit: 1m)

from(bucket: "home_energy")
  |> range(start: start_date, stop: now())
|> filter(fn: (r) => r._field == "Mains1_W" or r._field == "Mains2_W")
  |> filter(fn: (r) => r["_measurement"] == "house_power2")
|> pivot(rowKey: ["_time"], columnKey: ["_field"], valueColumn: "_value")
|> map(fn: (r) => ({ r with _value: r.Mains1_W + r.Mains2_W }))
|> aggregateWindow(
    every: 1mo,
    fn: (tables=<-, column) =>
      tables
        |> integral(unit: 1h)
        |> map(fn: (r) => ({ r with _value: r._value / 1000.0})))
|> keep(columns: ["_value", "_time"])
|> rename(columns: {_value: "Total Energy Uage Per Day", _time: "Date"})
1 Like
Thanks for that @wallacebrf . I tried for ages to get the integral function working but ended up setting up Wh measurements in the IotaWatt uploader so I could just sum the Wh measurements.
It means storing a bit more data but it worked ![]()
I’ll have a play with your code and see what I come up with as it will save a bit of storage.
OK I’m missing something I think.
This is what I have got running so far…
import "strings"
month = time(v: "${strings.substring(v: string(v: now()), start: 0, end: 8)}01T00:00:00Z")
from(bucket: "iotawatt")
  |> range(start: month, stop: now())
  |> filter(fn: (r) => r["_measurement"] == "consumption_power")
  |> filter(fn: (r) => r["_field"] == "value")
//|> pivot(rowKey: ["_time"], columnKey: ["_field"], valueColumn: "_value")
|> aggregateWindow(
    every: 1d,
    fn: (tables=<-, column) =>
      tables
        |> integral(unit: 1h)
        |> map(fn: (r) => ({ r with _value: r._value / 1000.0})))
|> keep(columns: ["_value", "_time"])
|> rename(columns: {_value: "Total Energy Uage Per Day", _time: "Date"})
It works except the range set isn’t working. My dash panel always reverts to whatever I have set in the drop down menu
This doesn’t seem to be working for me.
I also can’t see why I would need to pivot the table?
It is working without in my case.
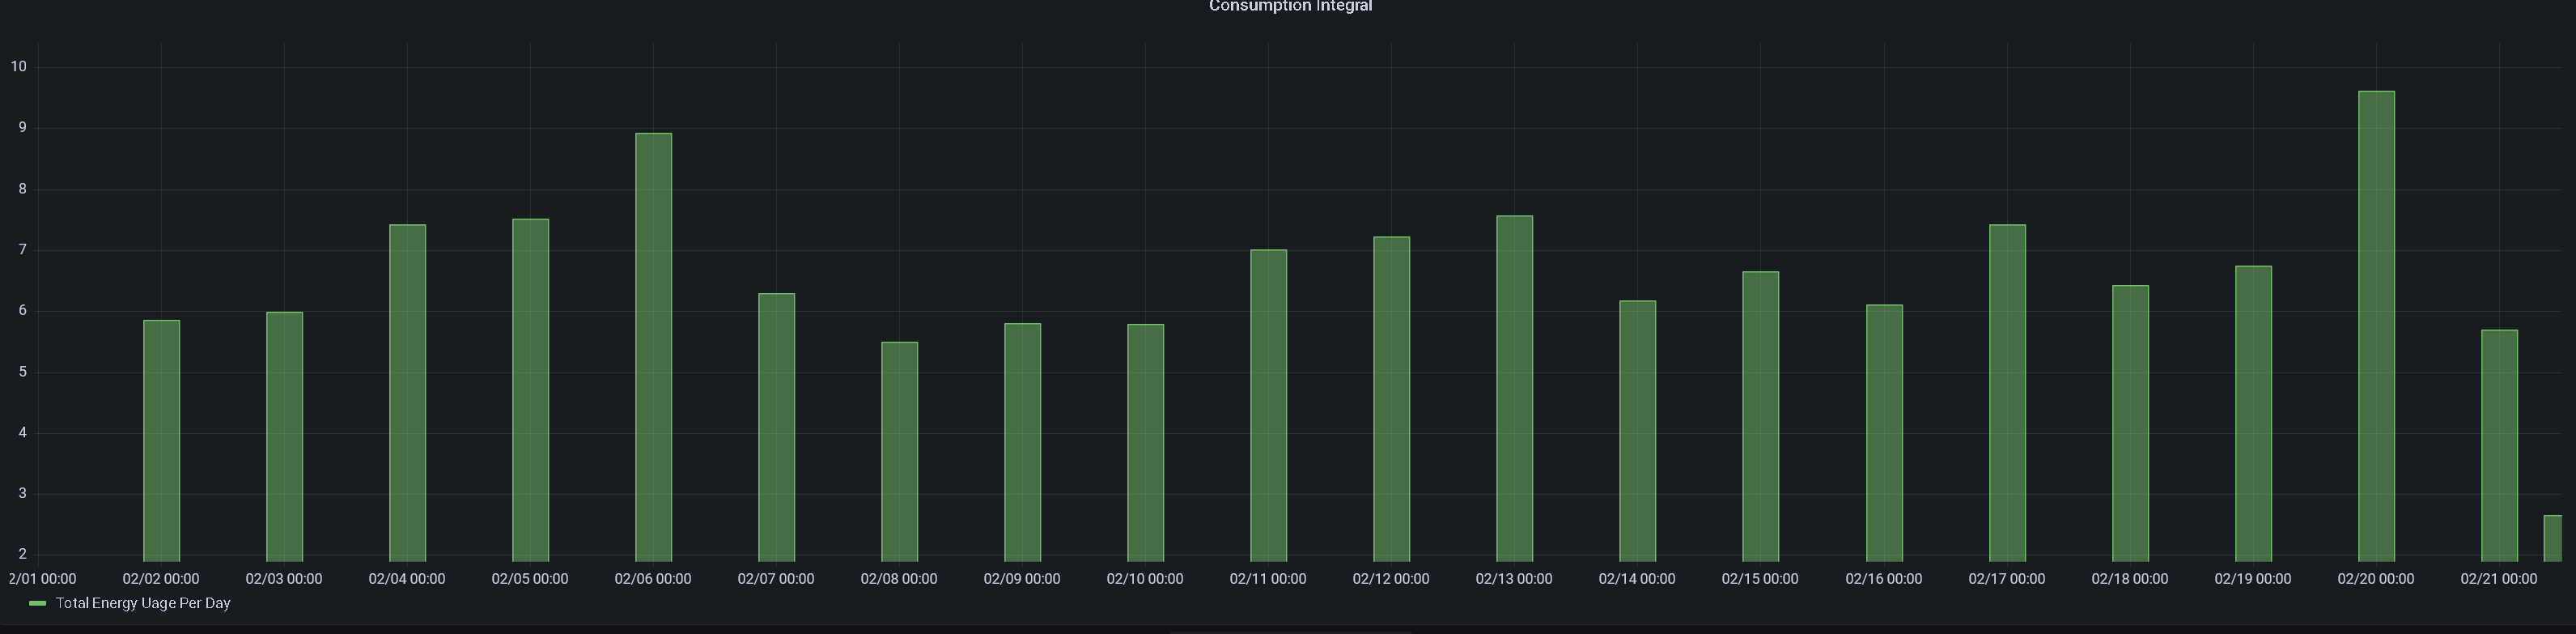
One other thing that is stumping me is that my columns are +1 day of the actual data. In other words yesterdays data is labeled with todays date. I’m guessing this is bacause the end time is 00:00:00 on the next day?
How can I change this so it shows the data for the correct day?
I attach a screenshot of my output.
that is really strange… i am not having those same issues.
let me look at a few things tonight and see what might be causing this… i wonder if it is a grafana setting?
i did look some last night and i agree the pivoting of the table is not needed. i was thinking that only looking at the code, not actually in front of InfluxDB seeing how the data comes out ![]()
it is good that you have it “working” if the grafana window is set right, so i agree it seems to be an issue with the |> range(start: month, stop: now()) code…
try this, replace the string manipulation with
month = date.truncate(t: now(), unit: 1mo)
and replace the range line with |> range(start: month) and see if that makes a difference.
That returns an error
invalid: error @2:9-2:13: undefined identifier date
oops! sorry, need to add
import "date"
to the beginning of the query
Sorry, I should have spotted that myself.
It works but still follows the pull down menu range ![]()
I have scoured the Grafana settings and ca’t find anything that might have a bearing on this.
You should read this thread: Setting different panels to different time ranges in a single dashboard - #12 by longoon12000 - Dashboards - Grafana Labs Community Forums
I think it might help you achieve your goal, if I understand your goal correctly. You do NOT need to edit the JSON, there is an unintuitively named UI control to do what you want.
Relative time:
I use: 30d/d to get 30 days worth, on actual days (instead of 30 24 hour periods prior to now, which is 30d)
You also NEED to use a Flux query that includes the timezones or you will get something close but not quite right (unless you live where it is always UTC).
1 Like