Thanks @frogmore this post from your link seems to do what I want…
In as much as it lets me set a time frame for individual panels independant of the Dashboard settings.
I need to study that thread a bit more to see if I can crack why I can’t do it in the queery itself.
I never had luck mixing strings and times. FWIW the following functions might be useful as alternatives:
experimental.subDuration → reduce a time value
experimental.addDuration → increase a time value
date.truncate → truncate a date to second, minute, hour, date, month, year
you need to import “experimental” and import “date” as needed.
There are two independent-ish things that need time. Grafana needs it to know what to display. You HAVE to set that with Relative time or the Grafana UI. InfluxDB needs to know the timespan of the data to get. It is best that those two ranges are the same, but Grafana will do its best even if they are not. However, its best is unlikely to be what you really want (unless the InfluxDB time range includes all of the Grafana time range).
@frogmore@Cliver
if the relative time setting within Grafana’s panels fixes your issue then fantastic!
what i am not understanding is that i am NOT using relative time unless i am missing something, yet by panels are working the way i am expecting
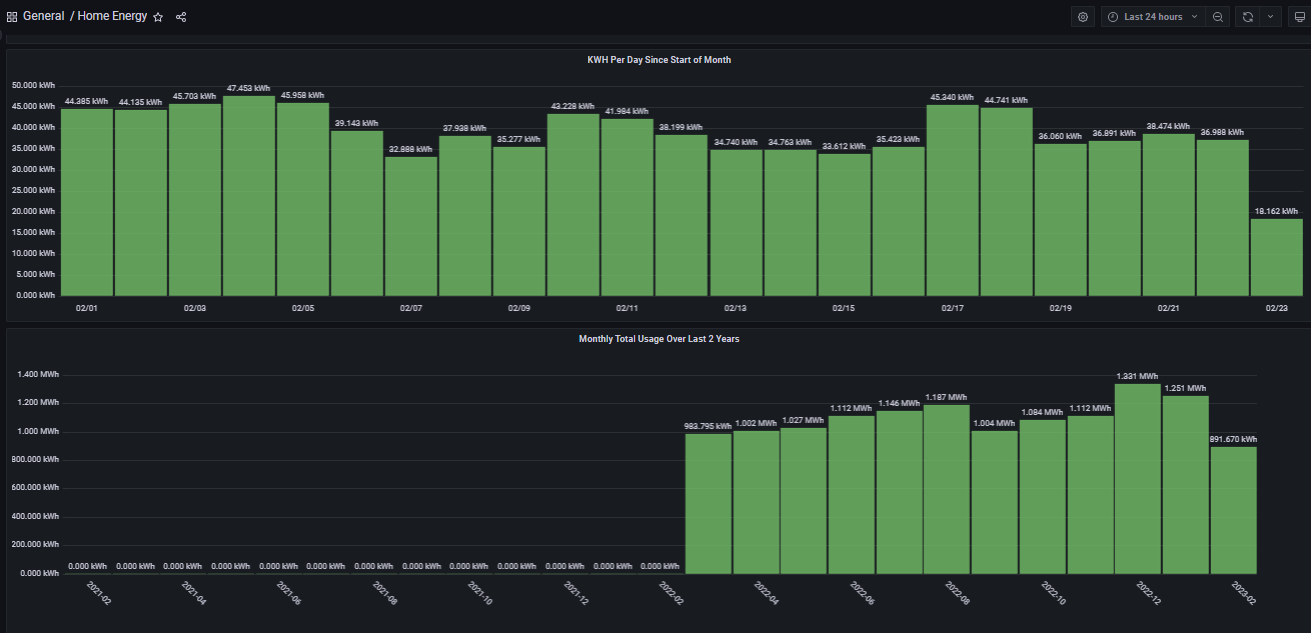
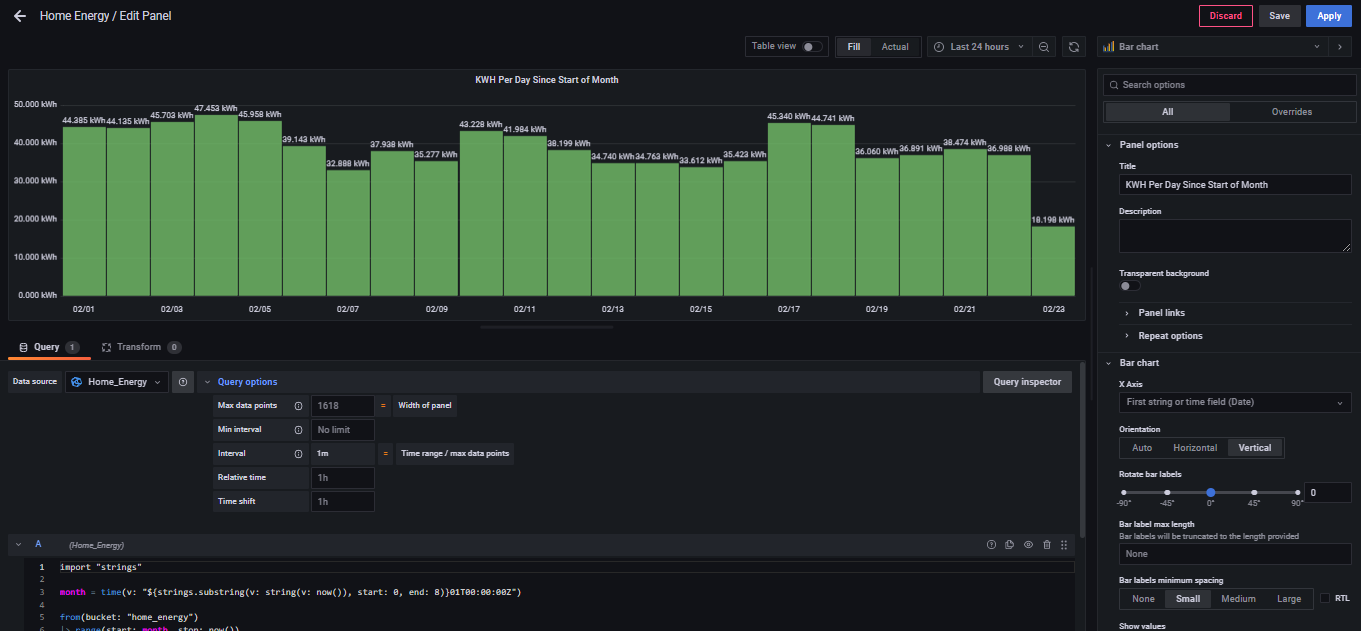
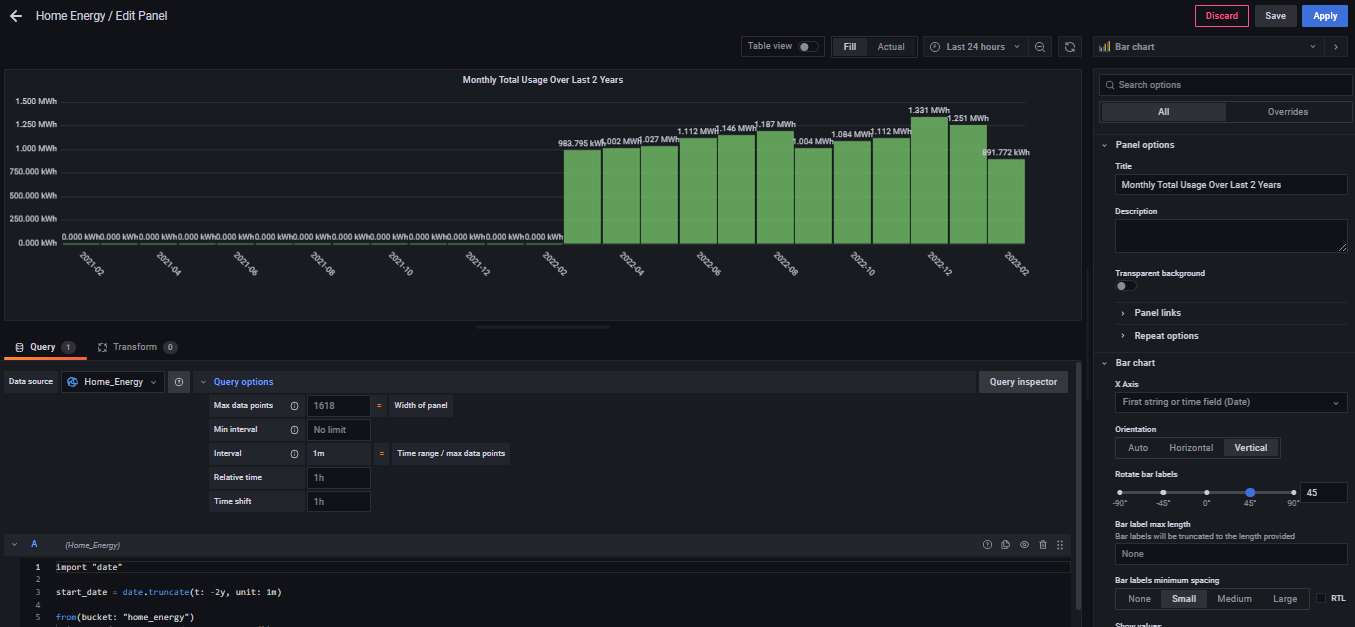
if you look at this, i have one panel that is showing usage per day since the start of this month, and below it i have a panel showing the usage per month for the last 2 years
@Tjootjim
i have also used date.truncate and it seems to work just as well as the string option, and i agree that it is more user friendly and direct compared to the string method
That’s what I can’t get my head around either.
Setting the relative time in the UI does indeed seem to give the results I want.
However, in my mind it would be better to do it in the query itself simply to make it more readable (the relative time setting is not exactly obvious) and it would be transportable as well.
I’m stuck ripping my batroom out for the next few days but will get back to it when I can.
I would really like to find out why it’s working for you @wallacebrf but not for me.
I’ll get to read up on the thread posted by @frogmore and see if that throws any light on the subject.
Comparing the JSON will likely shed some light.
The relative time method makes it clearer the panel is NOT on the same time scale as the others. Neither of your panels are using the value from the time range selector, so perhaps there is a setting to use what the data has in it. Both Flux and IQL give you the option to provide data that is inconsistent with the selected time range.
You are quite right @frogmore , I hadn’t noticed the timeframe notice in the top right corner when you set a relative timescale.
I have tgried everything I can think of to get it working in the query code to no avail
I tried using the monthly and yearly examples here… https://docs.influxdata.com/flux/v0.x/stdlib/date/truncate/
But still they folow whatever I set in the time range drop down.
I’m getting exactly what I want using the relative time drop down option and think it will satisfy all my needs. @wallacebrf Still confused as to why I can’t get it working in the query code though.
The only thing I can think of is are we using the same versions?
I am on version 9.3.
It is possible your JSON has some settings that are not displayed in the UI.
Create a fresh/new panel and see if you can get the same behavior. You can then compare the JSON to see what is different. Most of the settings have reasonably understandable names.
Thanks for all the advice on this guys. I am, for the time being, moving forward using the relative time option.
This is giving me pretty much everything I need at the moment.
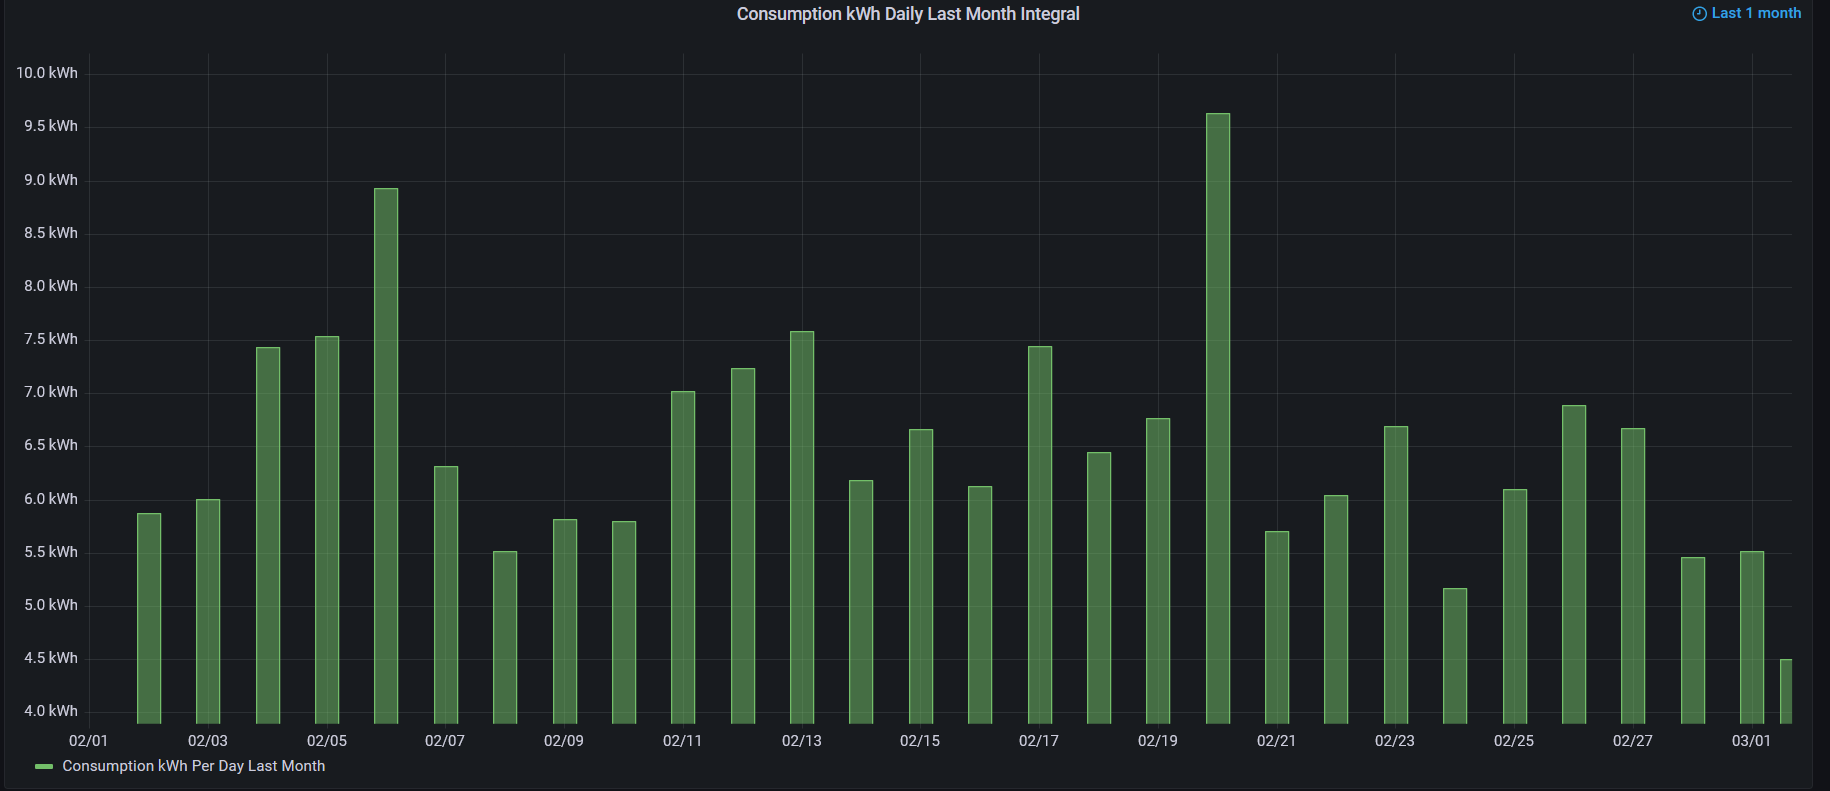
The only issue I have with this (and indeed my previous) solution is that my dates seem to be one day out.
i.e. Data that appears in my IotaWatt graph for say 19th Feb 2023 appears in my Grafana graph under 20th Feb and so on.
It is time stamped, in this example, in grafana as “2023-02-20 00:00:00”
It is using relative time now-1M/M.
The query code is:
// Setup your timezone info so that the day resets for you correctly.
import "timezone"
option location = timezone.location(name: "Europe/London")
from(bucket: "iotawatt")
  |> range(start: v.timeRangeStart, stop: v.timeRangeStop)
  |> filter(fn: (r) => r["_measurement"] == "consumption_power")
  |> filter(fn: (r) => r["_field"] == "value")
  |> aggregateWindow(
    every: 1d,
    fn: (tables=<-, column) =>
      tables
        |> integral(unit: 1h)
        |> map(fn: (r) => ({ r with _value: r._value / 1000.0})))
|> keep(columns: ["_value", "_time"])
|> rename(columns: {_value: "Consumption kWh Per Day Last Month", _time: "Date"})
As you can see it misses out day 01 of the month and puts that data into day 02 and so on.
It produces the same results if I set relative time to this month.
As far as I can see the problem is the query ends at 00:00:00 on the day after it should as opposed to 23:59:59 on the last day of the month, or even 00:00:00 on the last day.
(This brings to mind why, in the military we never used 00:00:00Z one day ended at 23:59:00Z abd the next started at 00:00:01Z. Saved any confusion abut which end of the day you were refering to.)
okay, looks like you do have timezone set, so make sure your machine that is running InfluxDB has the correct time and timezone
I haven’t tried it in flux yet, but have it working in IQL. Note that you can use IQL on newer versions of InfluxDB and it seems to be faster/easier for some things.
SELECT integral("Watts") / 1000/60/30 FROM "iotawatt" WHERE ("channel" = 'HPWH_A') AND $timeFilter GROUP BY time(1d) fill(null) tz('America/Vancouver')
Note that I want 2x the power listed, since it is only measuring half. Normally it should be “/1000/60/60” to get KWH.
Sorry to ask daft questions but…
By IQL do you mean InfluxQL?
On the timezone front. I have everything running on Europe/London DST enabled. So at the moment everything is basically GMT/UTC.
Using the IotaWatt Graph+ I can produce the correct output with each day’s data in the correct column.
In InfluxDB Data Explorer I seem to be getting data in the right days. Although I haven’t found a way to produce a column graph in InfluxDB.
I also notice that if I change the aggregateWindow(every: 1d, fn: sum) to aggregateWindow(every: 1h, fn: sum) I get data for the 1st day of the month and the first day of the next month?
I am working on the import_energy query at the moment because it produces the same results and runs faster that running the integral of the power query.
What tests have you done to determine what is different?
Have you tried creating a brand new dashboard/panel/graph?
Does it behave the same way?
When I was experimenting with time shift, it was clear the graph time spec/line/limits were coming from Grafana time selector and not whatever the data had. The graph just ignored any extra data.
yes i create a new dashboard from scratch, with new panels and used my same FLUX query, and it continued to work as i expect. i will gladly upload my entire dashboard so someone who knows JSON can look at it
I suspect you have a unicorn installation of Grafana. Everything I have read has said that the Flux query data period does NOT control the graph time period.