So I’ve been searching for notes about using Influxdb and Iotawatt, and found a bunch, most from Brett Beeson, for example here:
http://brettbeeson.com.au/architecture-for-iotawatt-aws-influxdb-and-grafana/
That one, on the preferred section (#4) shows a table like this (hopefully ok to reproduce here from that page):
> select * from elec10s limit 10
name: elec10s
time                 ct      device    mean_current mean_pf mean_power mean_reacpower mean_realpower mean_v
----                 --      ------    ------------ ------- ---------- -------------- -------------- ------
2018-11-20T01:29:50Z cooking emontxa33 0.005        0.005   0.005      0.005          0.005
2018-11-20T01:29:50Z dhw     emontxa33 0.007        0.007   0.007      0.007          0.007
2018-11-20T01:29:50Z fridge  emontxa33 1.183        0.663   286.713    216.083        188.453
2018-11-20T01:29:50Z garage  emontxa33 0.008        0.008   0.008      0.008          0.008
Key to this is that the same ct name (tag) is showing different measurements, but you can’t enter it that way in the outputs. At least I can’t seem to.
I’ve seen other postings with similar, but I cannot get Iotawatt to do that, without cheating. Now I can cheat and edit config.txt and give the fields the same name for the data to extract.
> select * from iotawatt limit 4
name: iotawatt
time                Watts  ct            kWh
----                -----  --            ---
1584133200000000000 0      MasterBedBath 6e-7
1584136800000000000 463.17 MasterBedBath 0.4631756
1584140400000000000 457.51 MasterBedBath 0.4575044
1584144000000000000 340.51 MasterBedBath 0.3399592
Ignoring the time issue which is just CLI formatting, this works fine. The issue is this requires duplicating a name that the UI doesn’t permit. Probably with good reason?
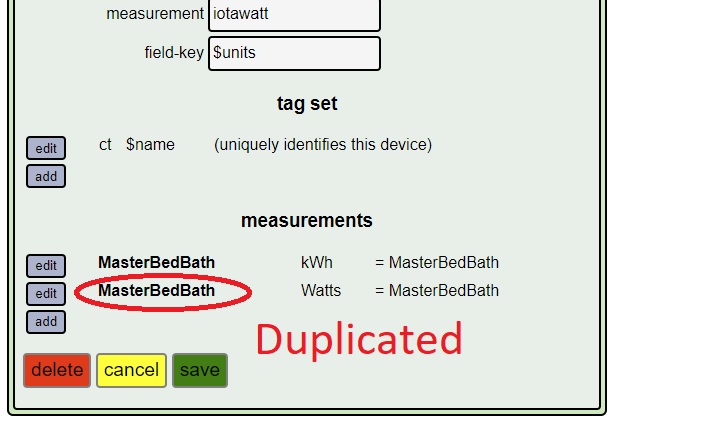
Now it’s not all that hard to do that in the config editor, but… am I breaking other things?
Honestly as I get further into this I’m not sure I need anything other than watts, but I was trying to follow the lead of others and…
Am I just misunderstanding how to get what’s in that first table?
If not, does anyone have a screen shot of the UI that does so? One that shows both tags and measurements?