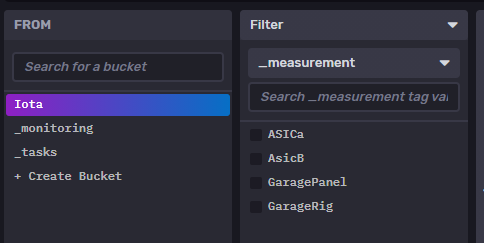
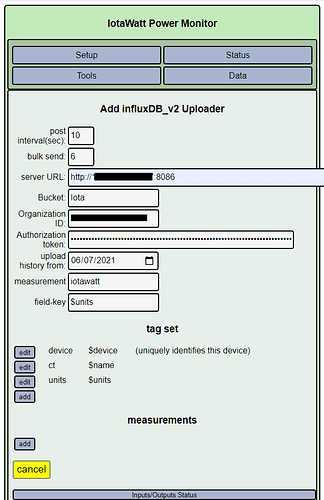
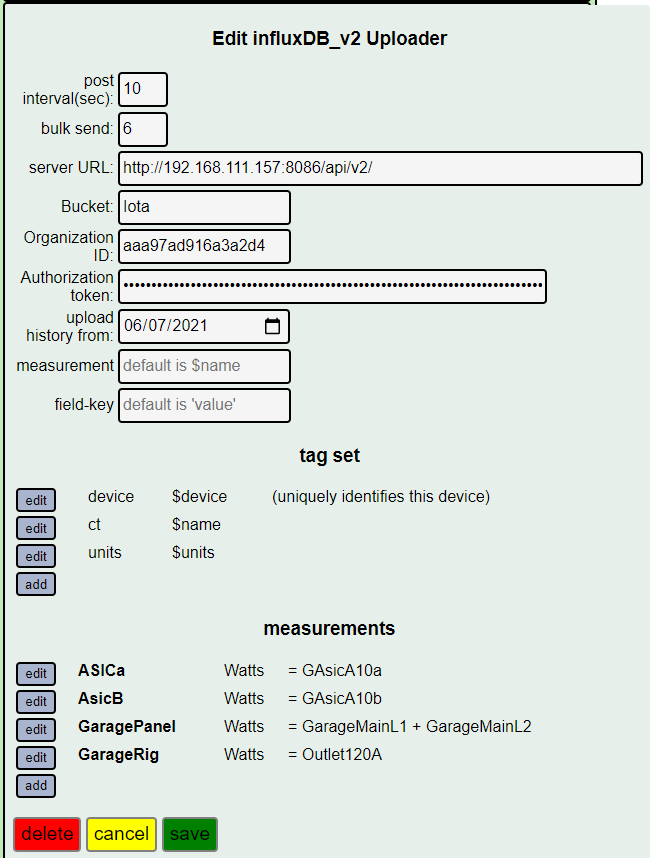
I’m at this point in the InfluxDB setup. I created all of the stuff in my Influx instance, but in iotawatt it doesn’t show the save button:
Three things:
-
You will not be able to save until you specify some at least one measurement.
-
For a local instance of influxDB2, the port 8086 is not used but the URI /api/v2/ must be added to the URL.
-
Are you sure you want to use “iotawatt” for all of your measurements?
I was just following an online example as well as a youtube example (that likely followed the online blog example) and this was how they set it up. I’m open to any suggestions, I have read the documentation and didn’t find it clear enough, so I don’t know enough (and as a result followed the blog).
My influxDB is on another server, which is why I specified IP + Port.
While there may be something out there, I’m not aware of a YouTube example for influxDB 2. If you have a link, I’d like to see it.
As far as setup of influxDB, it’s a very versatile database and so there is no one size fits all scheme for setup. There are some user discussions on this forum that you can search through for maybe some insight, but it’s not a cookbook resource. I’m afraid you will need to delve into the documentation for influx to understand how to organize the data and report with a tool like grafana.
All that said, graph+ within IoTaWatt can produce very insightful graphs using the built in datalog that you already have.
It is a long video, but he has some stuff there on IoTaWatt and influxDB.
I’m not worried about Influx itself or Graphana. I know how to use those. I can’t get IotaWatt to allow me to save anything to get the service even started that would send the data. I will try to dig in more, I guess, but without that save button un-hiding itself - I can’t do a lot. So - I think I have to figure out the measurement thing.
Without specifying measurements to send, using influx is pointless - you are not sending it any data.
One common scheme is to use the default measure by setting of $name, which uses the name of each output as the measurement name. You could try that and than add an output named “voltage” with units “volts” and specifying your channel 0 voltage input.
With that you should have a valid spec, get the save option, and start uploading.
I think I did get it now. I was confused with some of the video and blog info out there and thought that measurement was only doing calculations. I’m used to Manufacturing Historians, so this is a new way of doing things and had me confused  Sorry!
Which reminds me… will there be an MQTT addition at any point? I would like to run this into a few historians like Proficy and Canary just for fun.
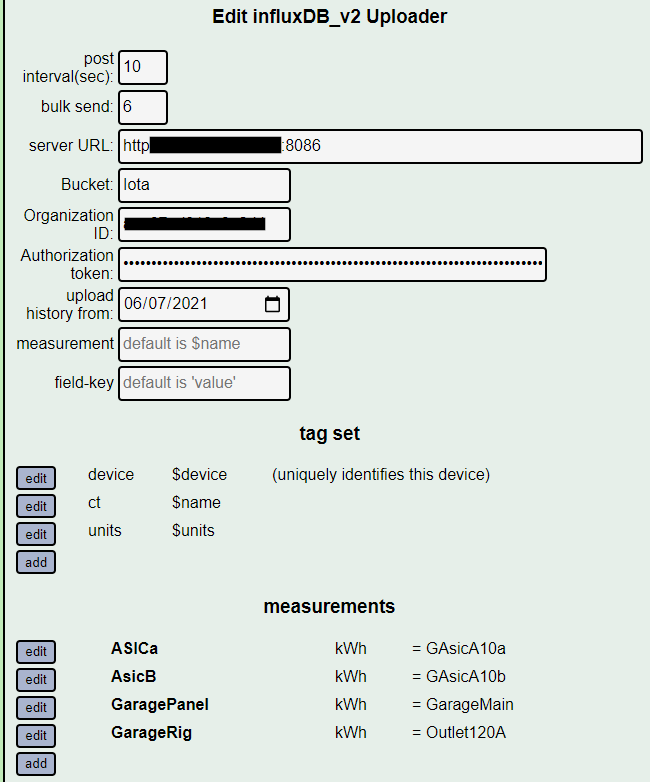
Here is my current Influx setup:
Does that look correct to you? The service seems to have started up correctly:
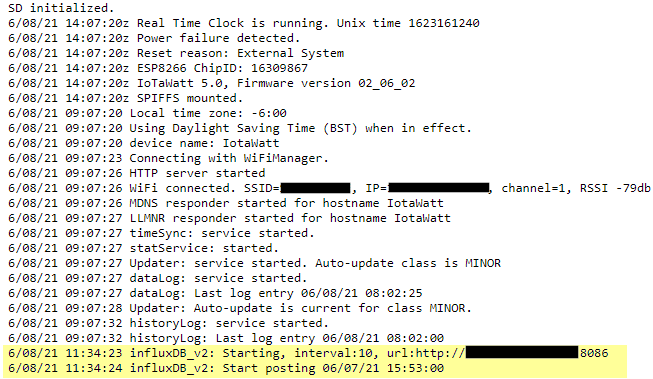
However, in InfluxDB I do not see any tag keys even when looking over the last 2 hour window and it should have been logging now for about an hour.:
Have you tried refreshing the influxdashboard?
You are uploading kWh used each 10sec. A 1kW load uses 1kWh per hr, so in 10 seconds it uses 1/360 or 0.002777 kWh. A 100W load will use 0.000277 kWh.
IoTaWatt only uploads kWh to three decimal places, so a lot of precision is lost. I always recommend uploading Wh instead. It is the same data, just more precision.
Alternatively, many folks upload Watts and use the integral function in influx to integrate Wh.
oh. ok, that makes sense. I can do that also. I didn’t know there was a precision limit, so went with what I thought would be the easiest method. Thanks!
I’m narrowing it down, but unsure what the error means:

Log file is fine:

And my setup is now like this:
It appears to have been my fault copying the token. I went into the InfluxDB interface to copy it from there instead of copying it from the command shell and it is mostly working.
Every once in awhile I see a “post failed 11”, but I now see the information I expected in InfluxDB!
