influxDB support

I was thinking of doing that. So you are saying instead of using the field key “value” use “watts” or “amps” etc? That makes sense. I was trying to come up with a way to specify multiple units for one measurement, so for instance you could ask for watts and pf for a circuit and the entry would have two entries in the field set for those units. In any event, the format leaves the door open for that in the future.

That’s how it works now. When it gets behind, or if bulk-send is greater than 1, it will aggregate the measurements into a larger HTTP transactions.

1 Like

According to this https://docs.influxdata.com/influxdb/v1/guides/write_data/ I think the following format should be perfect:

watts,input=1,name=MyFirstInput value=0.55 1422568543702900257
amps,input=1,name=MyFirstInput value=2.0 1422568543702900257

etc…

@overeasy@fredrike – I’m just happy we’re discussing this. I haven’t submitted any PR’s yet, just a happy user, will look into doing so in the future. (Would you prefer PR’s in GitHub over the forums here?)

Influx isn’t your only consumer and this data-model complexity may not be worth it (I can always reorganize locally). Just popped in since I saw the database format was changing. I think my queries previously capture the format/query goals I was trying to advocate.

If i had to come up with a UI for this, perhaps it would be a IoTaWatt input label + some check boxes:
INPUT_1_LABEL [ amps ] [ watts ] [ va ] [ pf ] ...
OUTPUT_X configured_output_unit [ enable ]

Which would then correspond to an influx “line protocol” of something very simlar to @fredrike’s proposed format:
<unit>,name=INPUT_1_LABEL,input=1 <configured value>=XX.XXf <time>
^^ i really liked the name and the input here – allows some improved mapping from the measurement to the database without double de-aliasing.

Just to highlight the tags here – Grafana’s alias via tags is a very powerful feature that I’ve grown to love.

1 Like

We should also support user custom tags here to uniquely identify each IoTaWatt unit.

Should we really have <configured value> should that not “always” just be value?

I created an issue on github a couple of days ago and in the comment I show how data from Home-Assistant is represented in influxdb vs. data from IoTaWatt (Better support for outputs · Issue #145 · boblemaire/IoTaWatt · GitHub), allowing grouping by (in the Home-Assistant case) friendly_name allows for really easy and powerful graphs in grafana.

Don’t forget the ability to use Variable syntax | Grafana documentation for selecting subset of “inputs”.

With some pressure to finalize this, I’ve had to make some decisions. My sense is that while it doesn’t seem possible to accommodate all of the suggestions above, the input has helped shape an approach that should be workable for everyone.

I take some comfort in seeing that the influData folks themselves have different approaches in the several examples that they use. For instance the basic CPU load measurement examples and the entomological census example. It all bears on how the data will be used.

So here’s what I have in first level testing:

As hinted at a few days ago, the basic line protocol measurement is:

<output-name>[,<1st-tag-key=1st-tag-value[,2nd-tag-key=2nd-tag-value[,....]]] value=<output-value> <time>

I liked the idea of using the measurement units instead on “value” in the field-set-key, but this doesn’t seem to play well with grafana in specifying aggregation functions with regular expressions. The basic configuration screen looks like this:


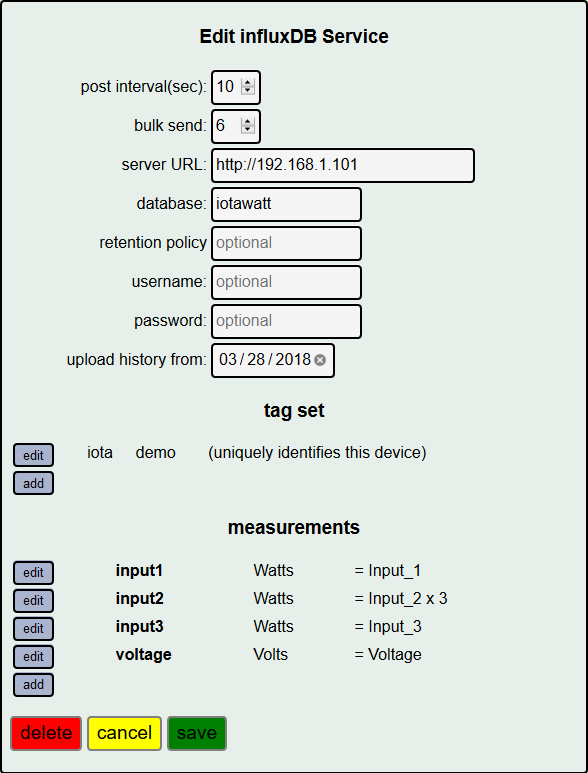
Notice that there are some new specifiers:

  • retention policy has been added. I’m not sure why this hasn’t been mentioned before by anybody, but it needed to added and if specified will be associated with the measurements. If left off, influx will use the default policy.
  • upload history from: If specified, establishes the starting point for uploading available history. If there are any entries in the database, qualified by the first tag, the time of the last entry will override. This is mostly useful when first setting up an influx server, or for cleaning existing data and uploading a modified data view.

The status display now has a tab for influxDB:
image
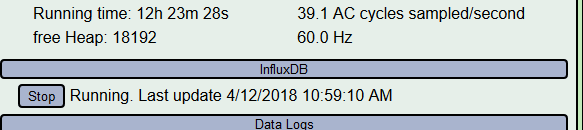
The influx service can now be started and stopped. This way, you don’t need to discard your configuration to suspend updating. The current running/stopped state is displayed, and the time of the most recent posted measurements is continuously displayed. When the service is stopped, it will query the database for most recent updates when restarted. So if you drop the most recent measurements, it’s possible to upload fresh measurements using a modified specification.

I hope to have this available for ALPHA by the weekend. The standard disclaimers apply to ALPHA subscribers.

I’m sorry to say but this is not a very good solution either. <output-name> should be a “tag” and the first parameter should be “unit” as this allows really sweet grouping in grafana.

<unit>,name=<output-name>[,1st-tag-key=1st-tag-value[,2nd-tag-key=2nd-tag-value[,....]]] value=<output-value> <time>

Should however be perfect.

Edit:
This allows for queries like this in grafana (where $temp_id is a variable set from a dropdown menu).

I was working with a different view:

I guess it depends on what you are trying to do. Your temperature example does reinforce the notion that these measurements can be introduced into a database including other forms of energy. There’s no perfect solution. If it’s any consolation, it would be possible to offer different influx schemes in the future. Id rather keep that in reserve than try to make one user interface do all things for all people.

Thanks for the input.

1 Like

CCCAs I worked to finalize this today, I added the ability to override the defaults using variables. It’s possible that this will accommodate all of the schemes that have been advanced. I’ve defined three variables:

  • $device = the “Device name” in the setup/device section.
  • $name = the name of the current output.
  • $units = the units associated with the current output.

I’ve added two new specifications to the influxDB configuration:

  • measurement = The name to be used for each measurement. Default is ‘$name’
  • field-key = the string to be used as the key in the field set. Default is ‘value’

The new variables can be used in the following specifications:

  • measurement
  • tag value
  • field-key

So now, using the defaults, we get the following line protocol measurements:

<output name>[,tag-key1=tag-value1[,tag-key2=...]] value=<output value> <time>

If we specify measurement=$units and add a tag name=$name we get:

<output units>,name=<output-name> value=<output value> <time>

Watts,iota=test,name=input1 value=156.38 1523648480
Watts,iota=test,name=input2 value=467.56 1523648480
Watts,iota=test,name=input3 value=155.14 1523648480
Volts,iota=test,name=voltage value=118.96 1523648480

That should look familiar to @fredrike .

I think @matt case has measurement=iotawatt, a tag name=$name, and field-key set to $units:

iotawatt,name=<output name> Watts=<output value> <time>

iotawatt,iota=test,name=input1 Watts=155.46 1523648580
iotawatt,iota=test,name=input2 Watts=468.35 1523648580
iotawatt,iota=test,name=input3 Watts=154.72 1523648580
iotawatt,iota=test,name=voltage Volts=118.93 1523648580

In both examples there is an extra tag ‘iota’ which could be removed, just trying to make it easier to clean up after posting these examples to my database.

The rules are:

  • The variable names are case sensitive.

  • Variable names are replaced as they are encountered in a string, left to right. So if you have a tag-value of ‘$name.$units’, for output mains with units Watts the tag value would be ‘mains.Watts’ if the tag-value were ‘circuit.$name.02’ you would get ‘circuit.mains.02’.

  • All of the values that influx defines as strings can be specified in these fields with any characters except: white-space, " (double quote), ’ (single quote). They will be inserted into the relevant influx expressions unquoted.

  • If the $ is used outside of one of the variable names, it will be treated like any other character.

I’m thinking that this will allow complete flexibility in uploading data without injecting a lot of complexity. I’ll build dashboards around the default case, and it could end up that down the road contributed dashboards will require a specific data view. That’s something for anyone to consider before deviating from the defaults.

Here’s what I hope will be the final configuration page:

2 Likes

I look forward to trying this out in 05 sometime this week! Thanks for all of your work @overeasy!

I am attempting to get uploads to InfluxDB working, but no luck yet. The logs show I am getting an 400 from ‘last entry query failed’. Logs attached, the multiple 400 blocks are me attempting various changes to the config. Also screenshot of config.

The database exists, I can send/query random data from the commandline from a machine elsewhere on the network so shouldn’t be privledges/firewall issues.

Any ideas what is going wrong here?

log.txt (2.1 KB)

I think so. The HTTP code 400 is in response to the initial query where IoTaWatt is trying to determine the time of the last successful post. I think it’s failing because of how you are specifying the first tag set in your configuration.

I’m sure you’ve read the influx section in the wiki, but maybe you want to take another look at the way variables are treated. I’m probably too close to it and maybe didn’t explain it that well.

You are using $name for the value of the first tag-set entry that is used to identify the influxDB series associated with this IoTaWatt (for cases where multiple IoTaWatt are posting to the same influx database). $name, by definition, resolves to the name associated with each particular output that is defined. So during the initial context query, there is no particular output and so $name is undefined. I’ll look into how that corrupts the query and how to make this problem more obvious, but right now, I want to get your issue resolved.

Looking at the approach you’ve taken to sending measurements, the grid and heatpump measurements will have the same measurement name (watts) and the same field name (value). So you seem to want to differentiate the two using unique tags, name=[grid, heatpump]. That’s fine, but the first tag set should be something like device=$device. That tag will be the same for all of your measurements from this IoTaWatt and that’s important because the initial context query will use that, along with wildcards, to produce an initial query that looks at all of the latest measurements from this IoTaWatt to determine the last posting time.

So to sum up, try changing the first tag set to be device=$device and adding your unique identifier name=$name as the second tag set.

I have another stange issue with influxdb.

Everything worked fine until my influxdb server crashed (had a disk failure) now I can’t get my iotawatt (running Firmware version: 02_03_08) to upload data. It’s stuck on Running. Last update 01/01/1970 01:00:00 no matter what I do.

	"influxdb": {
		"type": "influxdb",
		"revision": 72,
		"postInterval": 5,
		"bulksend": 2,
		"url": "http://192.168.1.2",
		"database": "IoTaWatt",
		"measurement": "$units",
		"tagset": [
			{
				"key": "device",
				"value": "$device"
			},
			{
				"key": "entity_id",
				"value": "$name"
			},
			{
				"key": "unit",
				"value": "$units"
			}
		],
		"outputs": [
			{
				"name": "Bathroom",
				"units": "Watts",
				"script": "@4"
			},
			{
				"name": "Bathroom.kWh",
				"units": "kWh",
				"script": "@4"
			},
			{
				"name": "Inverter",
				"units": "Watts",
				"script": "@7"
			},
			{
				"name": "Inverter.kWh",
				"units": "kWh",
				"script": "@7"
			},
			{
				"name": "Total",
				"units": "Watts",
				"script": "@1+@2+@3+@4+@7"
			},
			{
				"name": "Volt",
				"units": "VA",
				"script": "@0"
			},
			{
				"name": "Voltage",
				"units": "Volts",
				"script": "@0"
			},
			{
				"name": "VVB",
				"units": "Watts",
				"script": "@2+@3"
			},
			{
				"name": "VVB.kWh",
				"units": "kWh",
				"script": "@2+@3"
			},
			{
				"name": "Washer",
				"units": "Watts",
				"script": "@1"
			},
			{
				"name": "Washer.kWh",
				"units": "kWh",
				"script": "@1"
			}
		],
		"stop": false,
		"begdate": null
	}

Could you post the message log please?

It does not seem like influx is running…
But I can’t click the stop button under Status, I just get a error alert saying that the configuration changed.

** Restart **

SD initialized.
6/24/18 18:42:59z Real Time Clock is running. Unix time 1529865779 
6/24/18 18:42:59z Power failure detected.
6/24/18 18:42:59z Version 02_03_08
6/24/18 18:42:59z Reset reason: External System
6/24/18 18:42:59z Trace:  254:177, 4:9, 246:4, 157:190, 243:216, 131:106, 172:223, 115:3, 206:89, 165:18, 93:199, 86:35, 35:171, 198:1, 86:222, 81:201, 45:242, 87:140, 238:206, 86:20, 166:137, 86:168, 254:107, 209:195, 36:187, 174:4, 7:147, 188:195, 168:173, 69:242, 255:124, 94:84
6/24/18 18:42:59z ESP8266 ChipID: 1847056
6/24/18 19:42:59 Local time zone: 1
6/24/18 19:42:59 device name: iotawatt, version: 3
6/24/18 19:43:02 Connecting with WiFiManager.
6/24/18 19:43:05 MDNS responder started
6/24/18 19:43:05 You can now connect to http://iotawatt.local
6/24/18 19:43:05 HTTP server started
6/24/18 19:43:05 dataLog: service started.
6/24/18 20:11:13 dataLog: Last log entry 2/6/6 07:28:15 
6/24/18 20:11:13 statService: started.
6/24/18 20:11:13 timeSync: service started.
6/24/18 20:11:13 WiFi connected. SSID: Fredrik_AP, IP: 192.168.1.22
6/24/18 20:11:13 Updater: service started. Auto-update class is ALPHA
6/24/18 20:11:14 updater: Auto-update is current for class ALPHA.

The problem appears to be that the datalog is not current. The message log suggests it is damaged. Without more information it’s not possible to determine what might have happened. You probably need to delete the current log:

HTTP://iotawatt.local/command?deletelog=current

The influx service will not start if the datalog isn’t opened and current.

Yes, that made it work again!

I’m starting to get really happy with my grafana dashboard too (had some outage as you can see).

Good! That probably means your history log is intact. I’m curious to see what it can tell me about your episode by comparing it’s content to the grafana above. Could you run the IoTaWatt local graph app and post a plot of your main for the last month?

Thanks

Thanks @overeasy, that did the trick. Data is happily flowing into Influx now.

However, I have come across another question about ‘measurements’ in the influx config. From experimentation it would seem each entry needs a unique name, adding entries with the same name seems to overwrite the existing entry. Although this seems a bit strange to have multiple entries of the same name it makes more sense when using a scheme like @fredrike proposed with measurement=$unit. Under this scheme it makes sense to have multiple measurements but with different units, for example a ‘grid’ measurement might have multiple entries for power, voltage, frequency etc. When this makes it into influx it would end up looking like this:

> show series
key
---
Hz,device=IotaWatt,name=grid
Watts,device=IotaWatt,name=grid
Volts,device=IotaWatt,name=grid

Of course this could be achieved by changing the ‘measurement’ to something unique (like gridHz, gridWatts, gridVOlts etc) but it becomes more painful when writing querys on the data. Perhaps I am missing something and this can be achieved now?

Also, a bit of an observation on some of the posts in this thread. Many references are made to using a tag of name=$name. While this is valid it causes a few issues since ‘name’ is a keyword in influx land and means the tag must always be escaped when used. Instead I have been using a tag of source=$name. For reference a list of keywords can be found here: Influx Query Language (InfluxQL) reference | InfluxDB OSS v1 Documentation Although these can be used as tags it makes things cleaner if they are avoided.

I understand that there are many ways to approach using influxDB. People have very different ideas about how to organize their data. From the IoTaWatt side, my goal was to allow as much flexibility as possible, without introducing unnecessary complexity. It’s a narrow path.

Personally I like the default settings (big surprise there) for the ability to generate grafana variables for each circuit. If you are interested in uploading more than Watts (and the integrated Wh). Then you could consider using field-key=$units. It all depends how you want to view it.

If you come up with a schema that you like that can’t be specified, I’m happy to consider ways to accommodate within this framework. I agree that influx keywords should be avoided, but there is a workaround in the query syntax. As I redo the documentation, I’ll try to work in a caution there.

Glad you have it working.