Great Thanks! This is a helpful tip; the error from iota at the time was actually that this query kept failing. This helped me resolve that.
During my experimentation I also somehow ended up with new series named…
There must be a concatenation bug somewhere…
This was a bit rhetorical – I intended to raise a question regarding why do we have a static value here that isn’t valuable in any queries. I also intended it to question you for other use cases that may not be clear to me (i.e. was there tooling that isn’t obvious already built elsewhere that required this…)
This comment makes me think we are talking past each other here. I don’t understand the issue your raising with cardinality (I’m only proposing tags for the sensor input names – those are strings and shouldn’t change).
Your concerns about storage are answered here (in which they recommend device identifiers are added as tags ![]() )
)
Setup background: I am running Influx in a Docker instance on an intel i5 quad (not an rPi!) consuming lots of local IoT metrics (not just IoTaWatt) at a rate of (100 events/s @ 2% cpu usage and only 5MB/12hr) so I agree that I’m not a normal user… never claimed to be.
I also acknowledge your point about the limits of the ESP device – that’s why I’d love to have all of this data in influx with as little CPU/BW as possible and avoid complicated script execution!! JFYI – to level-set context – I interact with global-scale Influx-like environments on a daily basis, I probably am making assumptions on shared-experiences that aren’t there, I’m just trying to steer these metrics with some lessons learned from a different life.
Anyway – let’s ground a use-case here.
My examples in the previous post were – bad – and lacked context. I have a lot of half-baked ideas for the IoTaWatt (this is why I love the OSS format, thank you again for all your work) but here are the ones I am currently working on (happy to contribute back if others are interested), that I’d love to see full support for with the new influx format.
Goals for influx data:
- Calculate un-monitored components (W/A/VA/PF/AC Cycles on channel).
- Calculate total usage across Right/Left of 220v input (W/VA/PF)
- Integrate for KWH across specific components
- Calculate VA/PF derivative across specific components/sensors
- Estimate W shifts/error based on V shifts on non-shifting components (i.e. LED 100khz smps constant current pwr supply won’t shift W usage based on voltage changes so these effectively detect real IoTaWatt measurement errors).
- Other Data-is-fun projects using ML which require lots of “signal” instead of just /watts/.
Setup:
- I use 12 inputs at the moment, and I have a web-scraper that monitors some of the internal IoTaWatt metrics (from the json); side-bar - Publishing those cycle counts/total counts to variables that could make it to influx would be great.
- 2 inputs are on the 120v US split-220v-main; right and left.
Acknowledging our goals are different… and recognizing scripting could make this easier AND also to avoid talking past each other, lets try to solve my first goal – purely in InfluxQL with 15m increments (with the intent to graph in grafana) using the various data-models we have discussed and that are built today:
BETA InfluxQL:
In influx-client:
create continuous query combined_cq on iotawatt
RESAMPLE EVERY 15m
begin
select sum(“watts”) AS “total_watts” into combined from (
select integral(value, 15m) as “watts” from /^power_.*/ GROUP BY time(15m) fill(null)
) GROUP BY time(15m) fill(null)
end;
create continuous query combined_cqv on power
resample every 15m
begin
select mean(value) as “volts” into combined from voltage group by time(15m) fill(null)
END;
create continuous query combined_cq_other on power
resample every 15m
begin
select integral(value,15m) as “counted_watts” into combined from /^sensor_.*/ group by time(15m) fill(null)
END;
In Grafana:
Watts Graph
- Calculate Unlabeled Power:
select total_watts - counted_watts from combined WHERE ($timeFilter)
- Calculated Labeled Power:
select total_watts from combined where ($timeFilter)
- Calculate Total Power:
select integral(value, 15m) as “watts” from /^power_.*/ where ($timeFilter) GROUP BY time(15m) fill(null)
Amps Graph:
- Unlabeled:
select (total_watts - counted_watts)/volts from combined WHERE ($timeFilter)
- Labeled:
select total_watts/volts from combined where ($timeFilter)
- Total:
select integral(value, 15m)/volts from /^power_.*/ where ($timeFilter) GROUP BY time(15m) fill(null)
In Alpha
Watts Graph:
- Unlabeled:
select (integral(power_right_w,15m)+integral(power_left_w,15m)-(integral(“sensor1”,15m)+integral(“sensor2”,15m)+…) from iotawatt WHERE ($timeFilter) GROUP BY time(15m)
a) List each sensor here in expansion … regexes not supported in integral function ;( - Labeled:
select (integral(power_right_w,15m)+integral(power_left_w,15m) from iotawatt WHERE ($timeFilter) GROUP BY time(15m) - Sum Labeled:
select integral(“sensor1”,15m)+integral(“sensor2”,15m)+… from iotawatt where ($timeFilter) GROUP BY time(15m) fill(null)
a) List each sensor here in expansion … regexes not supported in integral function ;( Total:
select (integral(power_right_w,15m)+integral(power_left_w,15m) from iotawatt WHERE ($timeFilter) GROUP BY time(15m)
Removes the need for CQ’s – this is great and a huge improvement above the current usage of series, still somewhat complicated queries that aren’t definable within Grafana (harder for someone to just use grafana to set this up) and requires maintenance/mapping manually.
Using tagging:
Where the output tag is the sensor_output name, and watt/amp/hz is a field name.
Watts Graph:
-
Unlabeled:
select integral(watt,15m) -
( select integral(watt,15m) from iotawatt where output=/^sensor_.*/ and ($timeFilter) GROUP BY time(15) fill(0))
from iotawatt where output=/^main_.*/ and ($timeFilter) GROUP BY time(15) fill(null)
-
Labeled:
select integral(watt) from iotawatt where ($timeFilter) GROUP by time(15m) fill(null)
a) Each sensor: select integral(watt) from iotawatt where ($timeFilter) GROUP by output, time(15m) fill(null)
-
Sum Labeled:
select integral(watt) from iotawatt where output=/^sensor_.*/ and ($timeFilter) GROUP by output, time(15m) fill(null)
-
Total:
select integral(watt,15m) from iotawatt where output=/^main_.*/ and ($timeFilter) GROUP BY time(15m) fill(null)
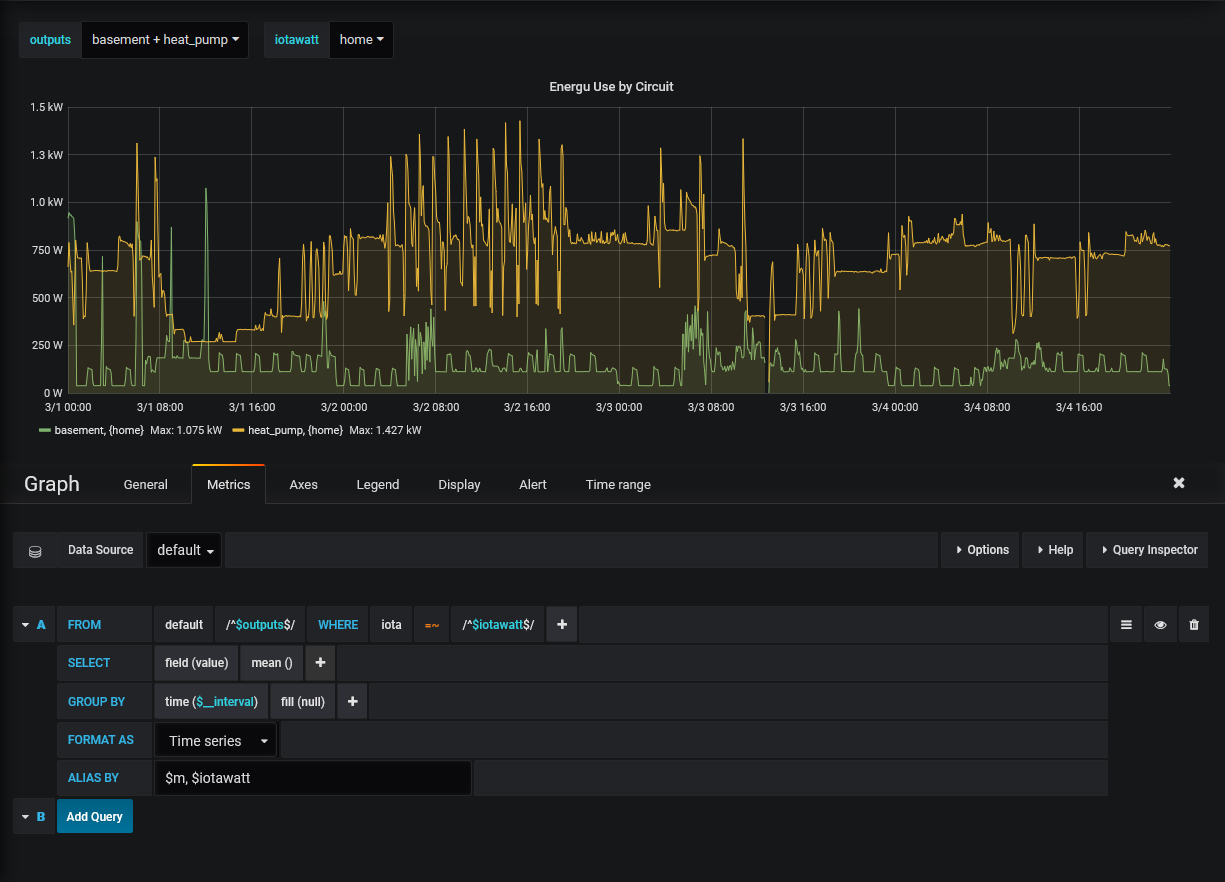
Almost fully data-driven – only one query is difficult to replicate (the subquery) within grafana. It can probably be achieved in another way with Grafana. Grafana’s alias by tagging is really nice combined with this tag grouping [$tag_output]
There may be easier ways to do each of these things, just trying to highlight the benefits of tagging when writing data-driven queries.