Yes, that made it work again!
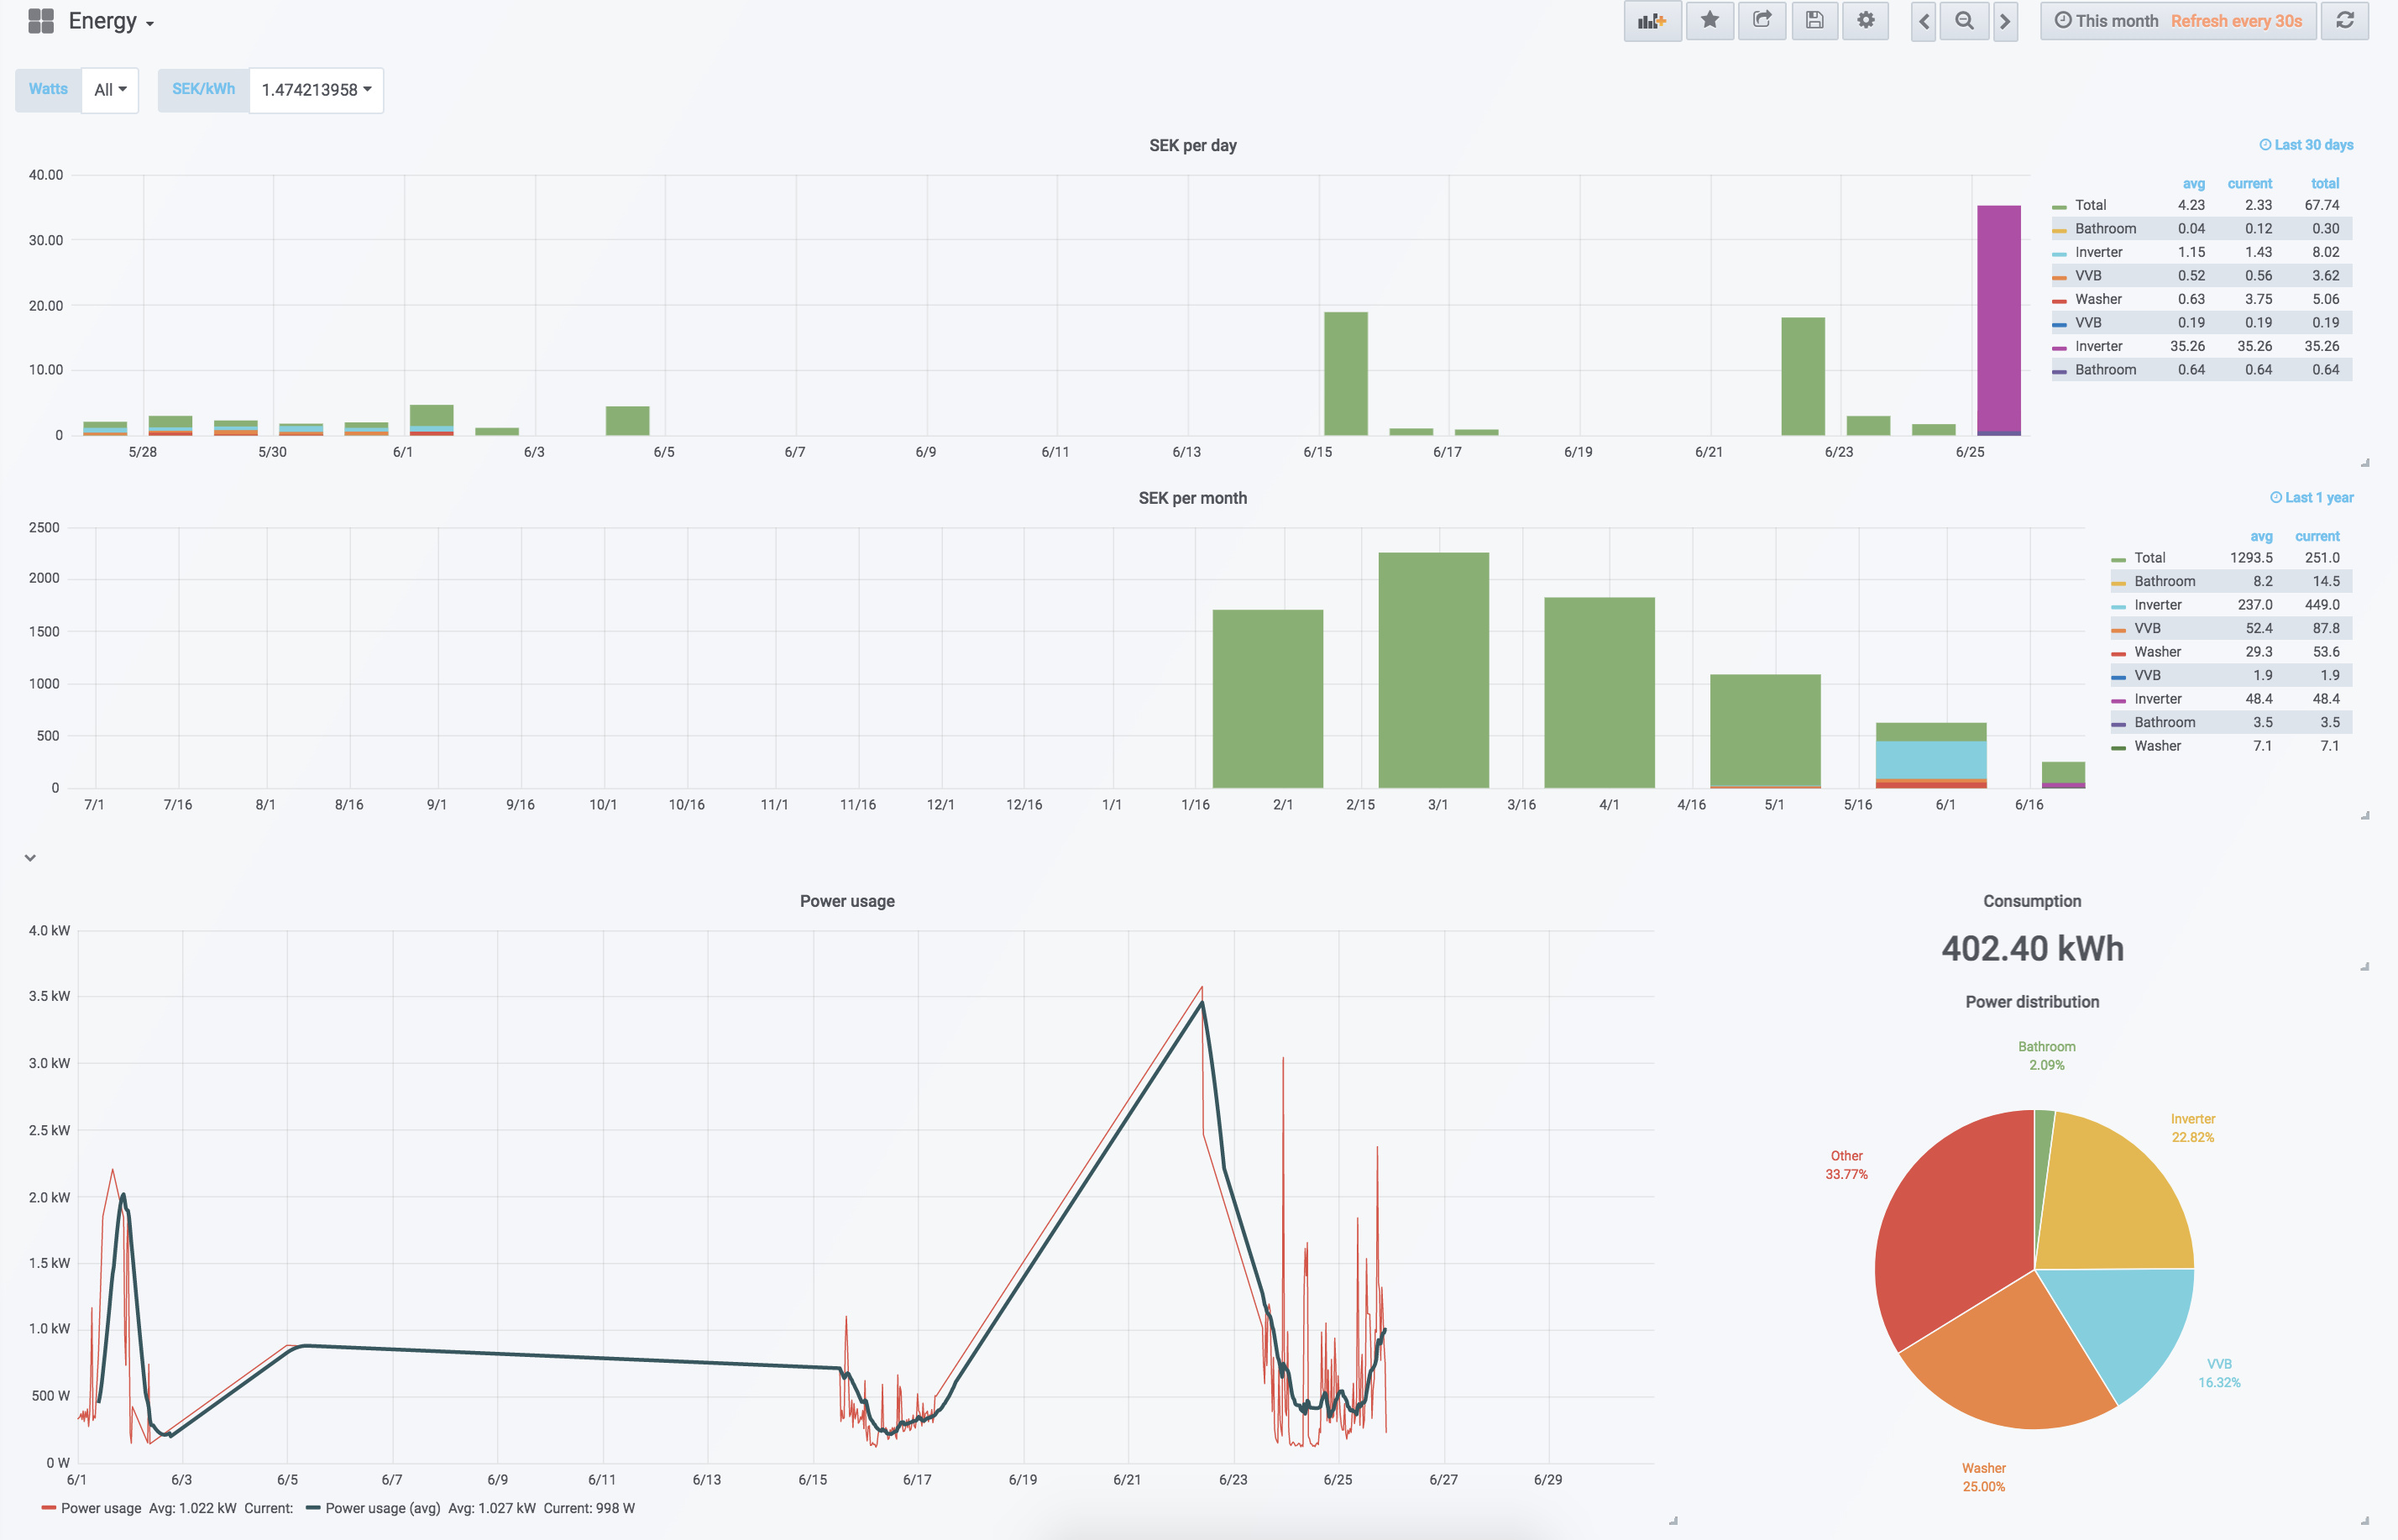
I’m starting to get really happy with my grafana dashboard too (had some outage as you can see).
Yes, that made it work again!
I’m starting to get really happy with my grafana dashboard too (had some outage as you can see).
Good! That probably means your history log is intact. I’m curious to see what it can tell me about your episode by comparing it’s content to the grafana above. Could you run the IoTaWatt local graph app and post a plot of your main for the last month?
Thanks
Thanks @overeasy, that did the trick. Data is happily flowing into Influx now.
However, I have come across another question about ‘measurements’ in the influx config. From experimentation it would seem each entry needs a unique name, adding entries with the same name seems to overwrite the existing entry. Although this seems a bit strange to have multiple entries of the same name it makes more sense when using a scheme like @fredrike proposed with measurement=$unit. Under this scheme it makes sense to have multiple measurements but with different units, for example a ‘grid’ measurement might have multiple entries for power, voltage, frequency etc. When this makes it into influx it would end up looking like this:
> show series
key
---
Hz,device=IotaWatt,name=grid
Watts,device=IotaWatt,name=grid
Volts,device=IotaWatt,name=grid
Of course this could be achieved by changing the ‘measurement’ to something unique (like gridHz, gridWatts, gridVOlts etc) but it becomes more painful when writing querys on the data. Perhaps I am missing something and this can be achieved now?
Also, a bit of an observation on some of the posts in this thread. Many references are made to using a tag of name=$name. While this is valid it causes a few issues since ‘name’ is a keyword in influx land and means the tag must always be escaped when used. Instead I have been using a tag of source=$name. For reference a list of keywords can be found here: Influx Query Language (InfluxQL) reference | InfluxDB OSS v1 Documentation Although these can be used as tags it makes things cleaner if they are avoided.
I understand that there are many ways to approach using influxDB. People have very different ideas about how to organize their data. From the IoTaWatt side, my goal was to allow as much flexibility as possible, without introducing unnecessary complexity. It’s a narrow path.
Personally I like the default settings (big surprise there) for the ability to generate grafana variables for each circuit. If you are interested in uploading more than Watts (and the integrated Wh). Then you could consider using field-key=$units. It all depends how you want to view it.
If you come up with a schema that you like that can’t be specified, I’m happy to consider ways to accommodate within this framework. I agree that influx keywords should be avoided, but there is a workaround in the query syntax. As I redo the documentation, I’ll try to work in a caution there.
Glad you have it working.
You can see attached the messages.
20180626_iotamsgs.txt (16.3 KB)
I had twice the case where influxDb stopped to report, I applied your trick, but I did not get back the data during the period where it was hanging…
The first case was when I updated ubiquiti wlan:
6/26/18 09:04:04 WiFi disconnected.
the second when I update synology (where influxDb docker is located)
6/26/18 13:53:32 influxDB: Post Failed: -4
IN both cases I tried to edit the Web Service and set the date to yesterday, but he did not load the history data
It’s not a trick. The message log in the other case indicated that the datalog was damaged. Yours was not. Now it’s gone - you deleted it. It will appear that you still have the data because the history log is still there, but the resolution of that log is only one minute, so it cannot be used to recover upload history.
I don’t know why your influx had not recovered with the WiFi, but there are a ton of external reasons that could have caused it. I’m confident that it was something external.
Deleting the current log is a serious matter. For the benefit of anyone else following this thread, you probably only want to do that if you have a reason to wipe your history (new deployment) or if I recommend it.
Fair enough. The problem I have with this approach is it makes the collection device the basis of the dataset, I like to think of the data itself being at the core of the dataset. With this approach the source of the data is simply a tag. For example, perhaps a power reading comes from a web interface to a solar controller, this would get stored in the database alongside power readings from IotaWatt. Thus when it comes time to graph them they can both be treated similarly and displayed as what they are, power readings. If the source is important (e.g. accuracy knowledge etc) this can be obtained from the tag set.
So, I think my ideal line protocol (for a given input channel) would be something along the lines of:
Power,device=IotaWatt,source=grid,units=Watts value=123.45 1523648480
Voltage,device=IotaWatt,source=grid,units=Volts value=230.65 1523648480
Frequency,device=IotaWatt,source=grid,units=Hertz value=150.1 1523648480
Not really a biggie, I realise adding this approach to the config is likely a lot of work. Just putting it out there as another option if you are reworking this portion of the code.
I suggest that you go with measurement = $units and set a tag as Key units = $units.
I think @fredrike suggestion almost gets you there. The problem is that you currently cannot have more than one output with the same name. That’s a limitation imposed by the general script subsystem for when scripts are used for ordinary outputs and in emoncms, but doesn’t need to apply here. I’ll take a look at what’s involved in removing that limitation, but also your original thought on using compound names that include the units could work with regular expression queries.
My influxdb session seems to die now and then, I think I’ve had to reset the datalog three times since you gave me this suggestion…
I would need to see the status display at the time you feel the datalog is not current. If your datalog is truly becoming damaged repeatedly, I would be suspicious that your SD card is damaged.
Have you tried simply restarting the IoTaWatt? What does the status look like just before and after the restart? I am looking into the possibility of a memory leak in the ALPHA release. If the heap gets down below 15K, posting to influx will stop. A simple restart will cure this.
If I cannot find the source of the memory leak (doesn’t happen top all systems), then I will simply detect it and restart every few days. With the one system that I have this problem on, it takes 5-6 days to get low enough to stop posting, but you may use more heap than I do for the basic configuration.
Deleting the current log will restart the IoTaWatt, so it may appear that is fixing your problem. What happens if you use the IoTaWatt graph app to plot something for the period you think the IoTaWatt was not posting because of log damage? If it shows data during that period, your log was not damaged.
Thanks for getting back to me, I’ll be more observant of different states next time it happens.
Btw, mqtt posting would be a great addon.
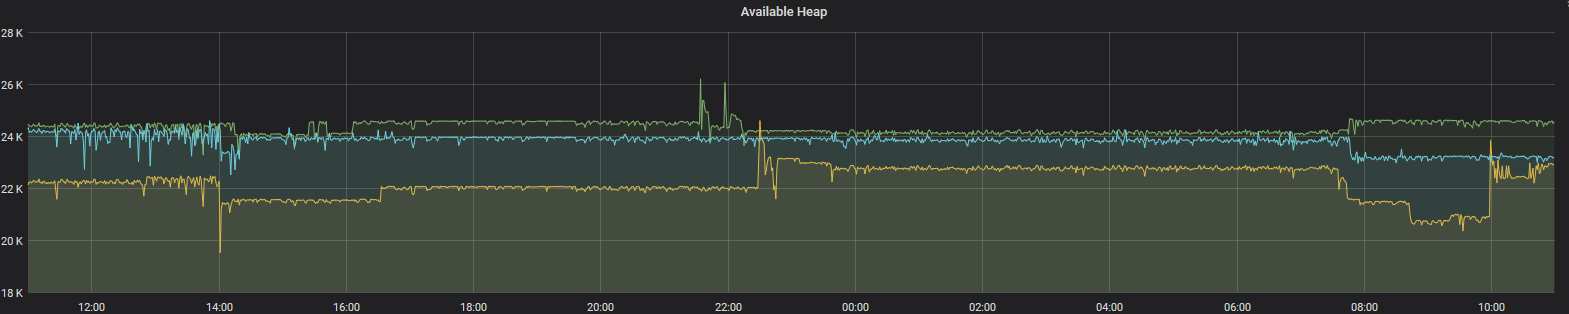
For debugging, you may record the heap size like any other measurement, on this way you may have history of it.
HI,
I read with this post, but I’m a little lost. I am looking to visualize addition or subtraction of load profiles (example: energy consumption - photovoltaic energy production). How do I configure iotawatt (measurement, tag, field) for using the influx queries for these operations?
regards,
SR
I’m experiencing the same issue (position stops after 5-7 days).
A restart do fix the issue though (and I don’t seem to loose any data, expect for when I first had the issue with the data-log).
Any idea of how to debug this further? It seems quite primitive to have a process that monitors my iotawatt and restarts it when it hangs.
It is ALPHA firmware. I’m working on the problem. As a bandaid I’ve removed the code that suspends posting on low heap and added an automatic restart. Since then I’ve found and fixed two memory leaks and my test systems appear stable now. The problem is that it takes a week to see if it worked.
Fredrike,
If you could answer these questions it could be helpful in final resolution:
So the heap seems stable over the first 6h…
Keep up the good work, it is really not that big of a deal if it crashes but it would be nice to get rid of it. Let me know if there are other things I can do to help you with debugging.
It is baffling. The first 12 hours or so always seem great, then the wheels fall off the wagon. Pretty sure it’s not a leak in the IoTaWatt firmware, but seems to be in the lower level TCP or IP in the web server. The losses seem to be either ~500bytes or 1K, so looks like a buffer not being released. There’s some cleanup code that has been added to lwip, but that has not been put into an official release of the core, and I won’t cut a release with the development core - too many other things changing and no real control.
I have some code under the hood to monitor heap as a piggyback in influxDB posts. I’ll leave it in the next release and influx users can turn it on by editing their confif.txt file. Maybe if I get some more data I can make sense of it.
Here are three of my test systems. There are some restarts in there.
If you look at the esp8266 Arduino issues in GitHub, you will see quite a few issues related to memory leaks and lwip/WiFi/networking. There is a 2.5.0 release scheduled for Aug 1. Perhaps that will fix enough issues to be worth using.