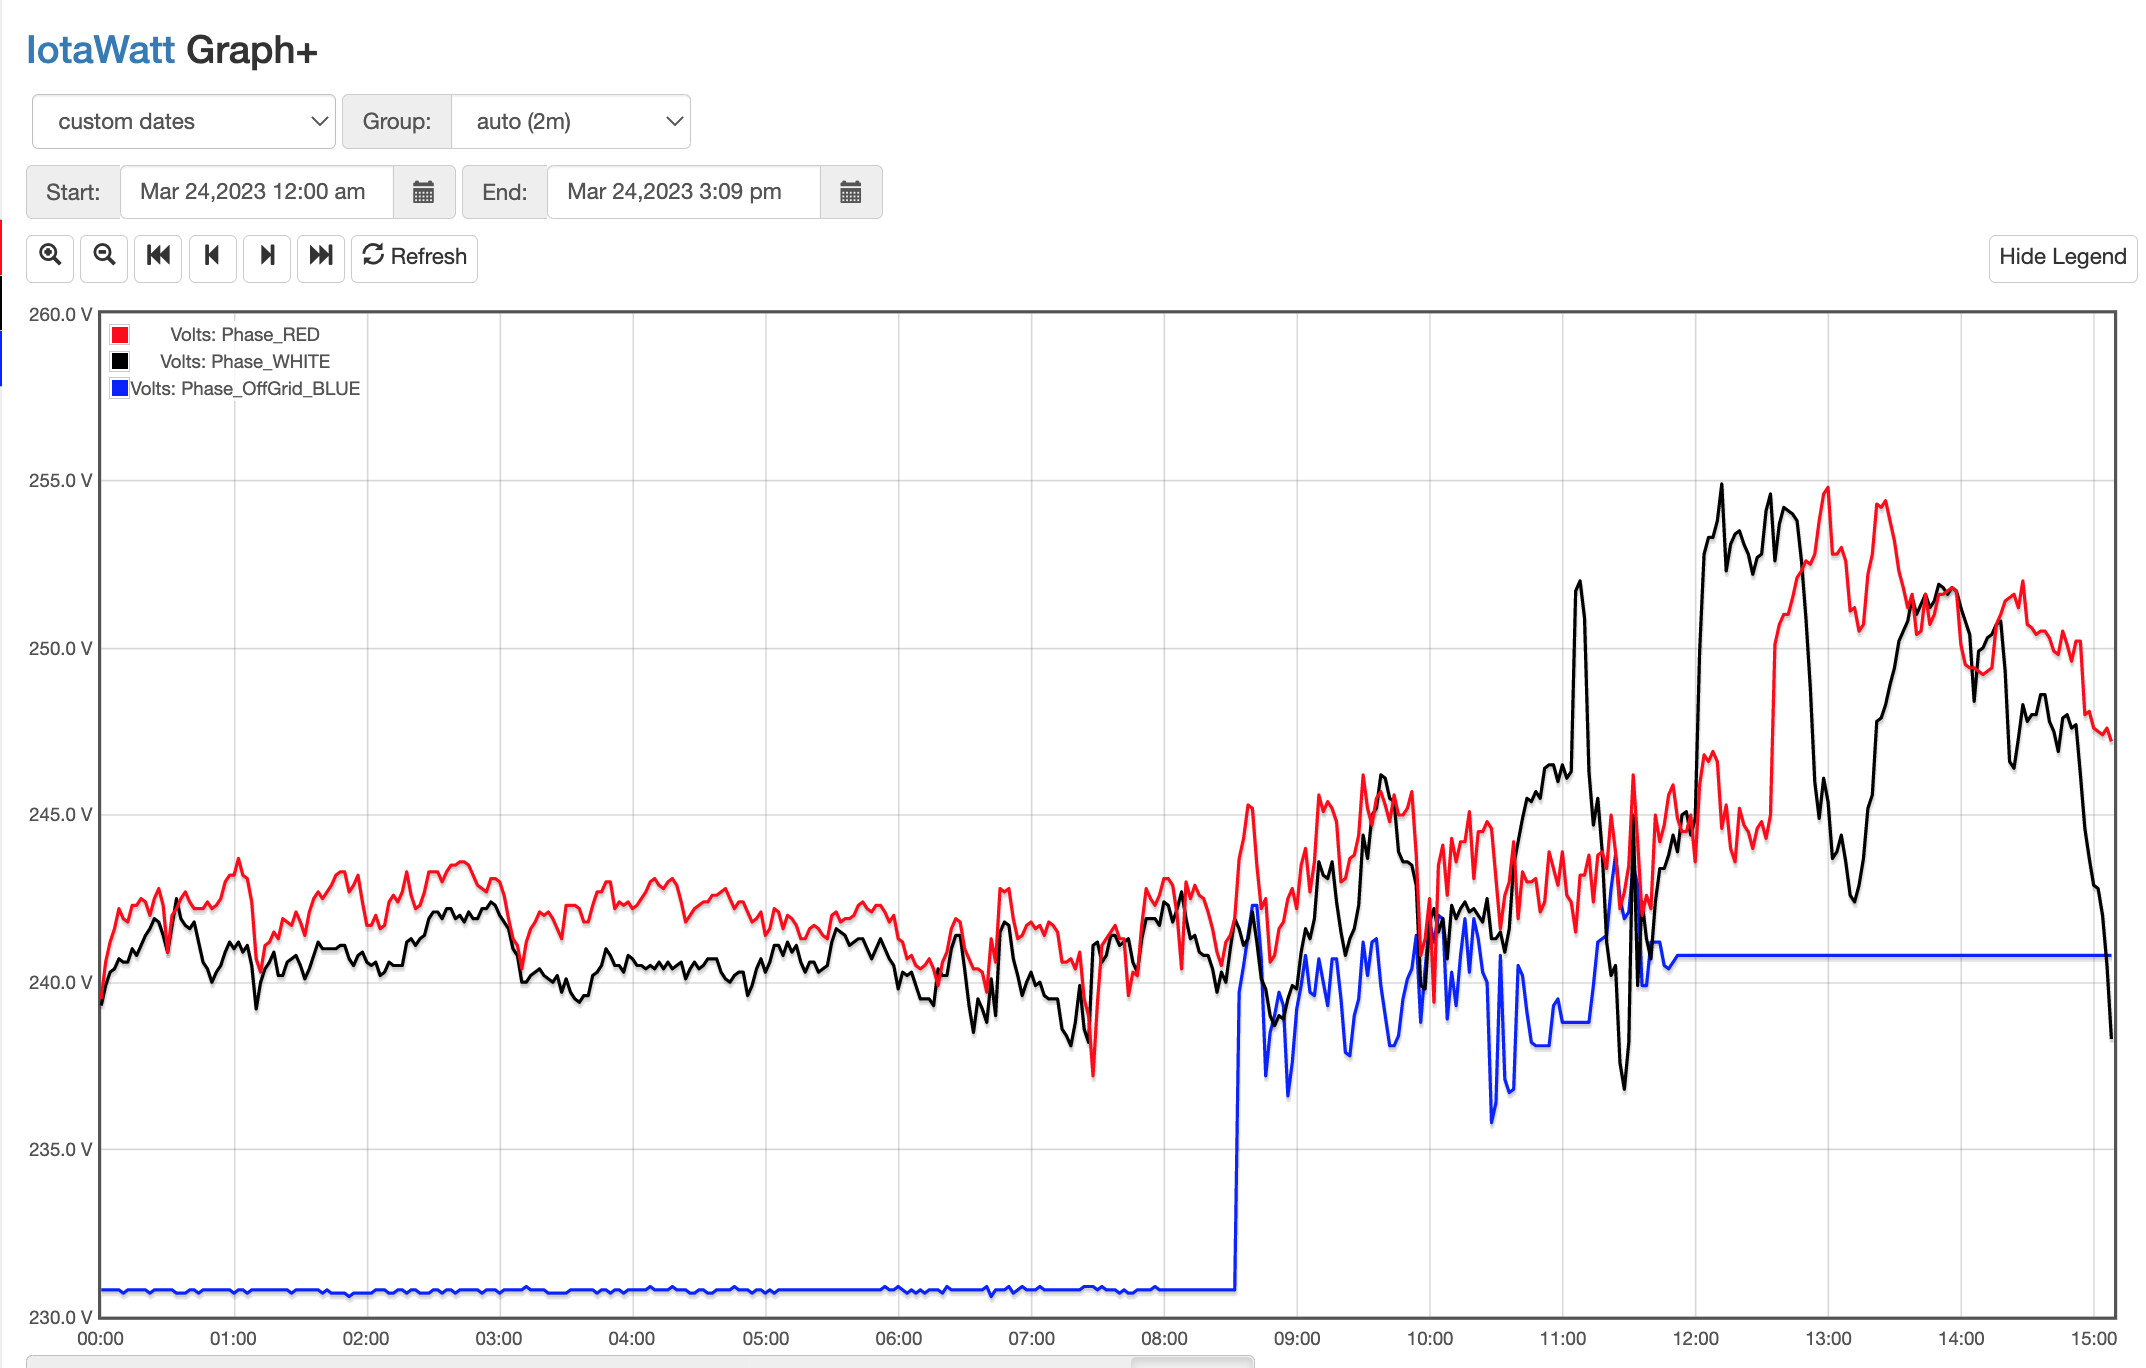
Can you plot the three voltages for the same period?
Sure.
I do appreciate the assistance.
The voltage jump (blue) at about 8:30AM would be the off-grid system cutting over from supplying power from battery to passing through grid power.
Then just before midday yesterday (same as the other charts) can see the voltage also goes flat line.
And for reference, here’s the output voltage as reported by the off-grid inverter for the same time period:
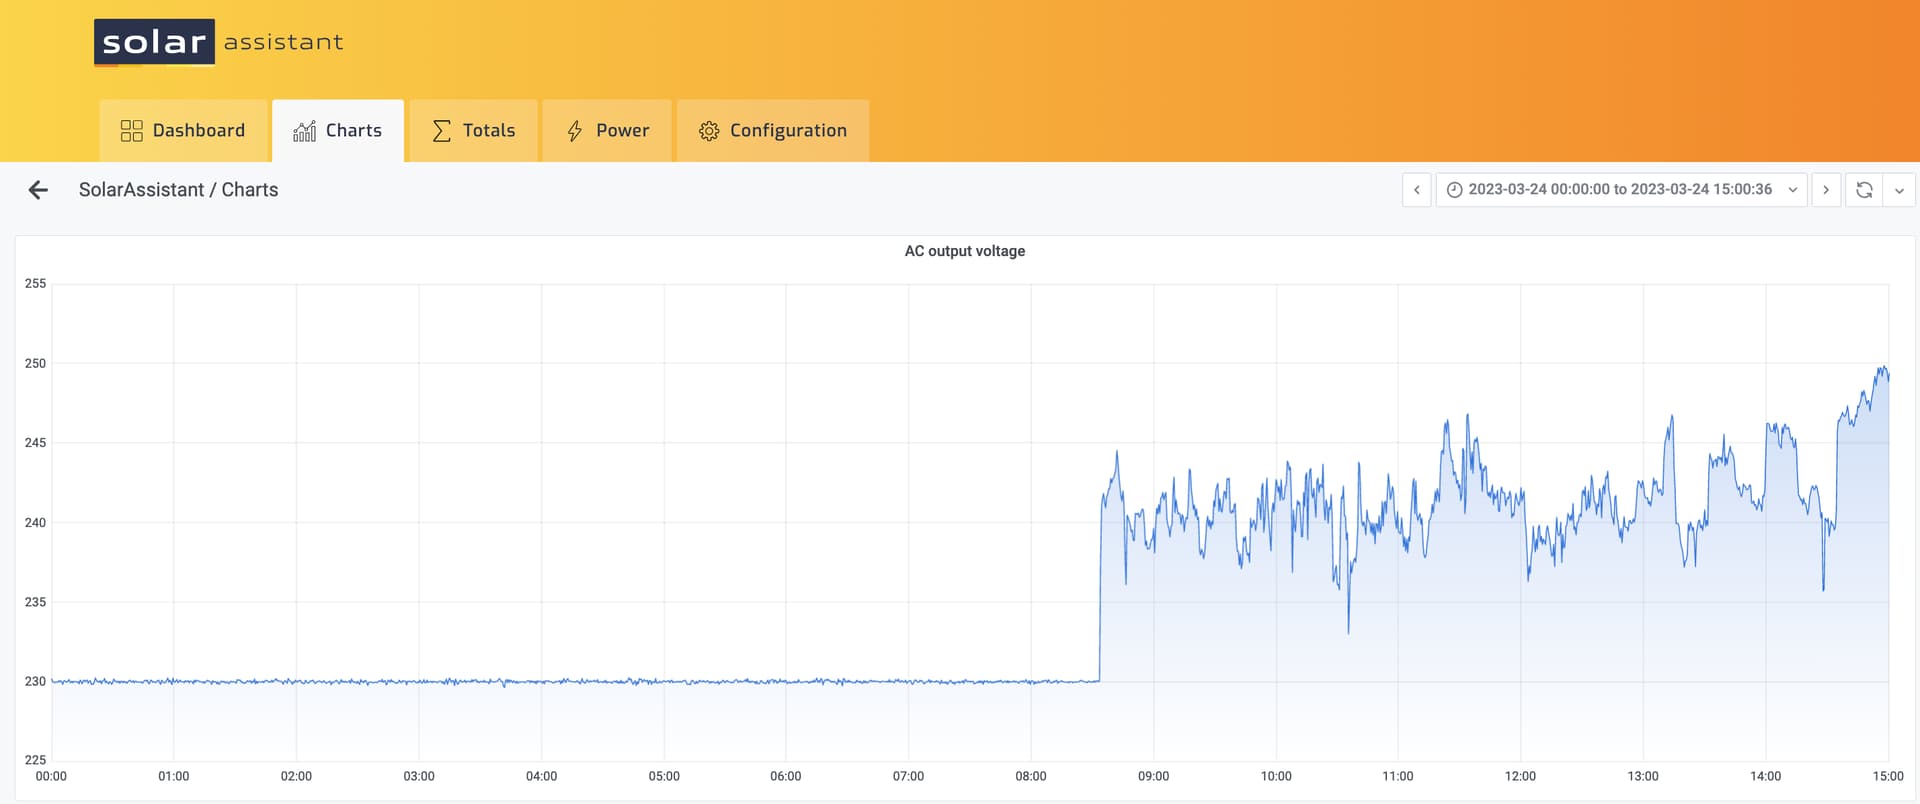
I thought so. There’s something Janky about the Blue offgrid voltage. Clearly there’s a changeover of some sort at about 8:40 am. Was that pure inverter output before then? After 8:40 I can see that the IoTaWatt is unable to lock on to the voltage signal, not just after 11:50, but there are also a few short flatlines on each side of 11:00am and probably some smaller episodes as well.
In order to detect a voltage signal, the zero crossings must be pretty clean. If its not a smooth sine-wave, where the maximum slope is at zero crossing, the voltage is cannot be sensed and power cannot be measured.
Yes.
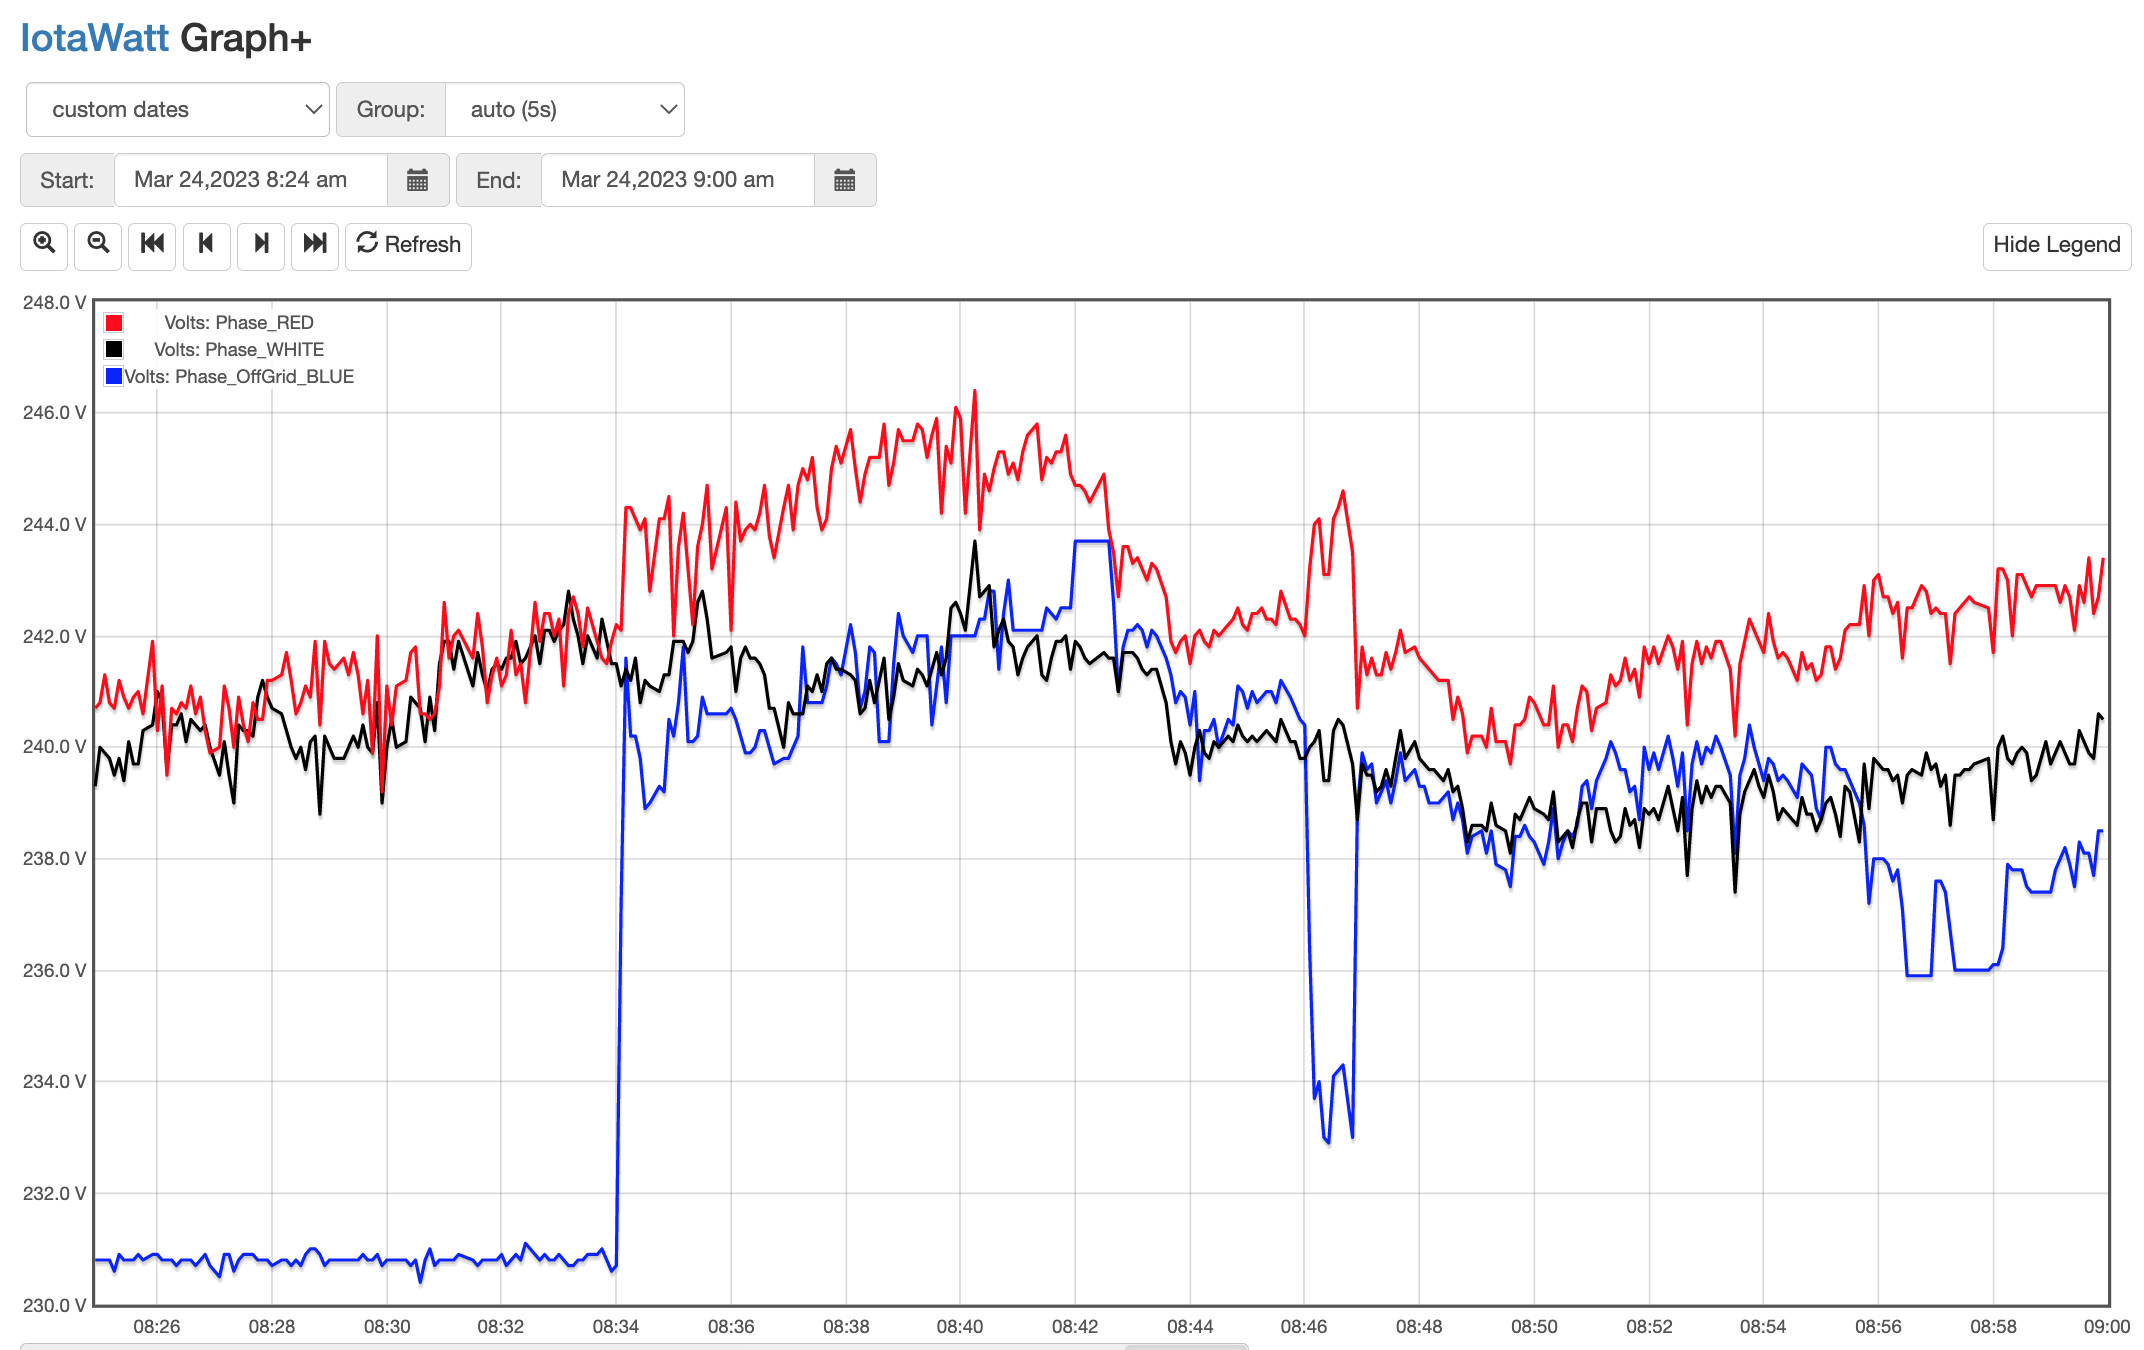
The inverter is supplying power during the night using energy from the battery, then at some stage in the morning it cuts over to pass through grid power. In this case a little after 8:30AM yesterday.
Here’s a zoomed in look at that period just before and after the change from inverter to grid supply:
I get this might be an issue for the brief moments of supply change over (although I note it did pick up that transition yesterday morning), but why would it go flat line for hours on end?
OK, this morning’s change over just happened a few minutes ago:
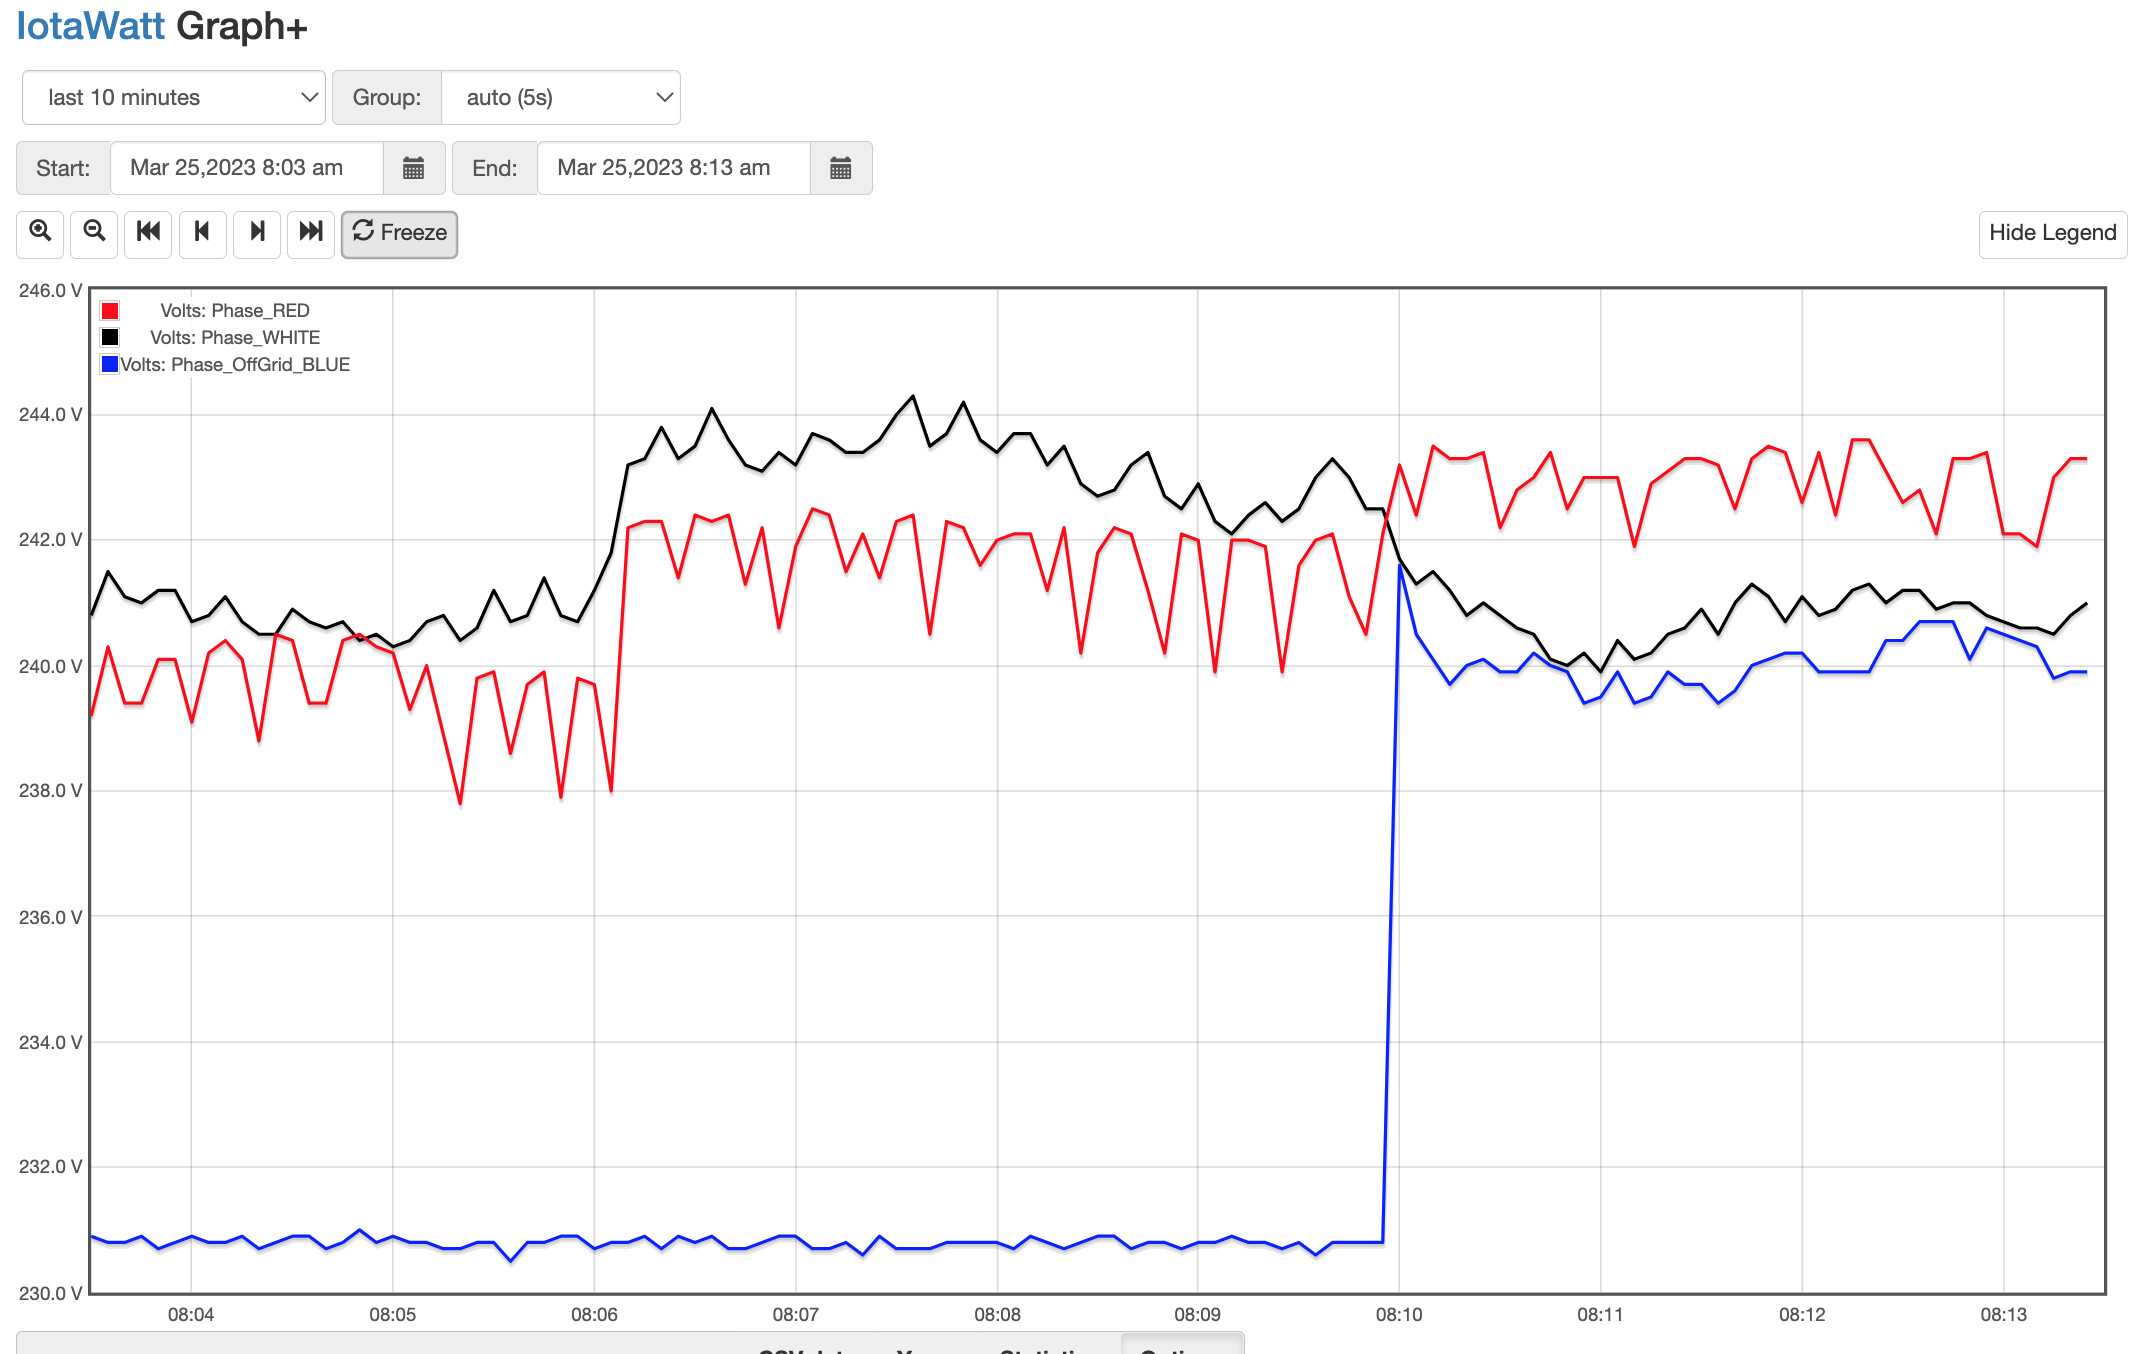
It picked up the change over no issues.
Will monitor today to see how it goes.
Do you still have the offgrid_AC_in using derived reference? If so, can you plot AC in and out together?
Yes.
Here is the AC power in and out from the inverter over last 30-min:
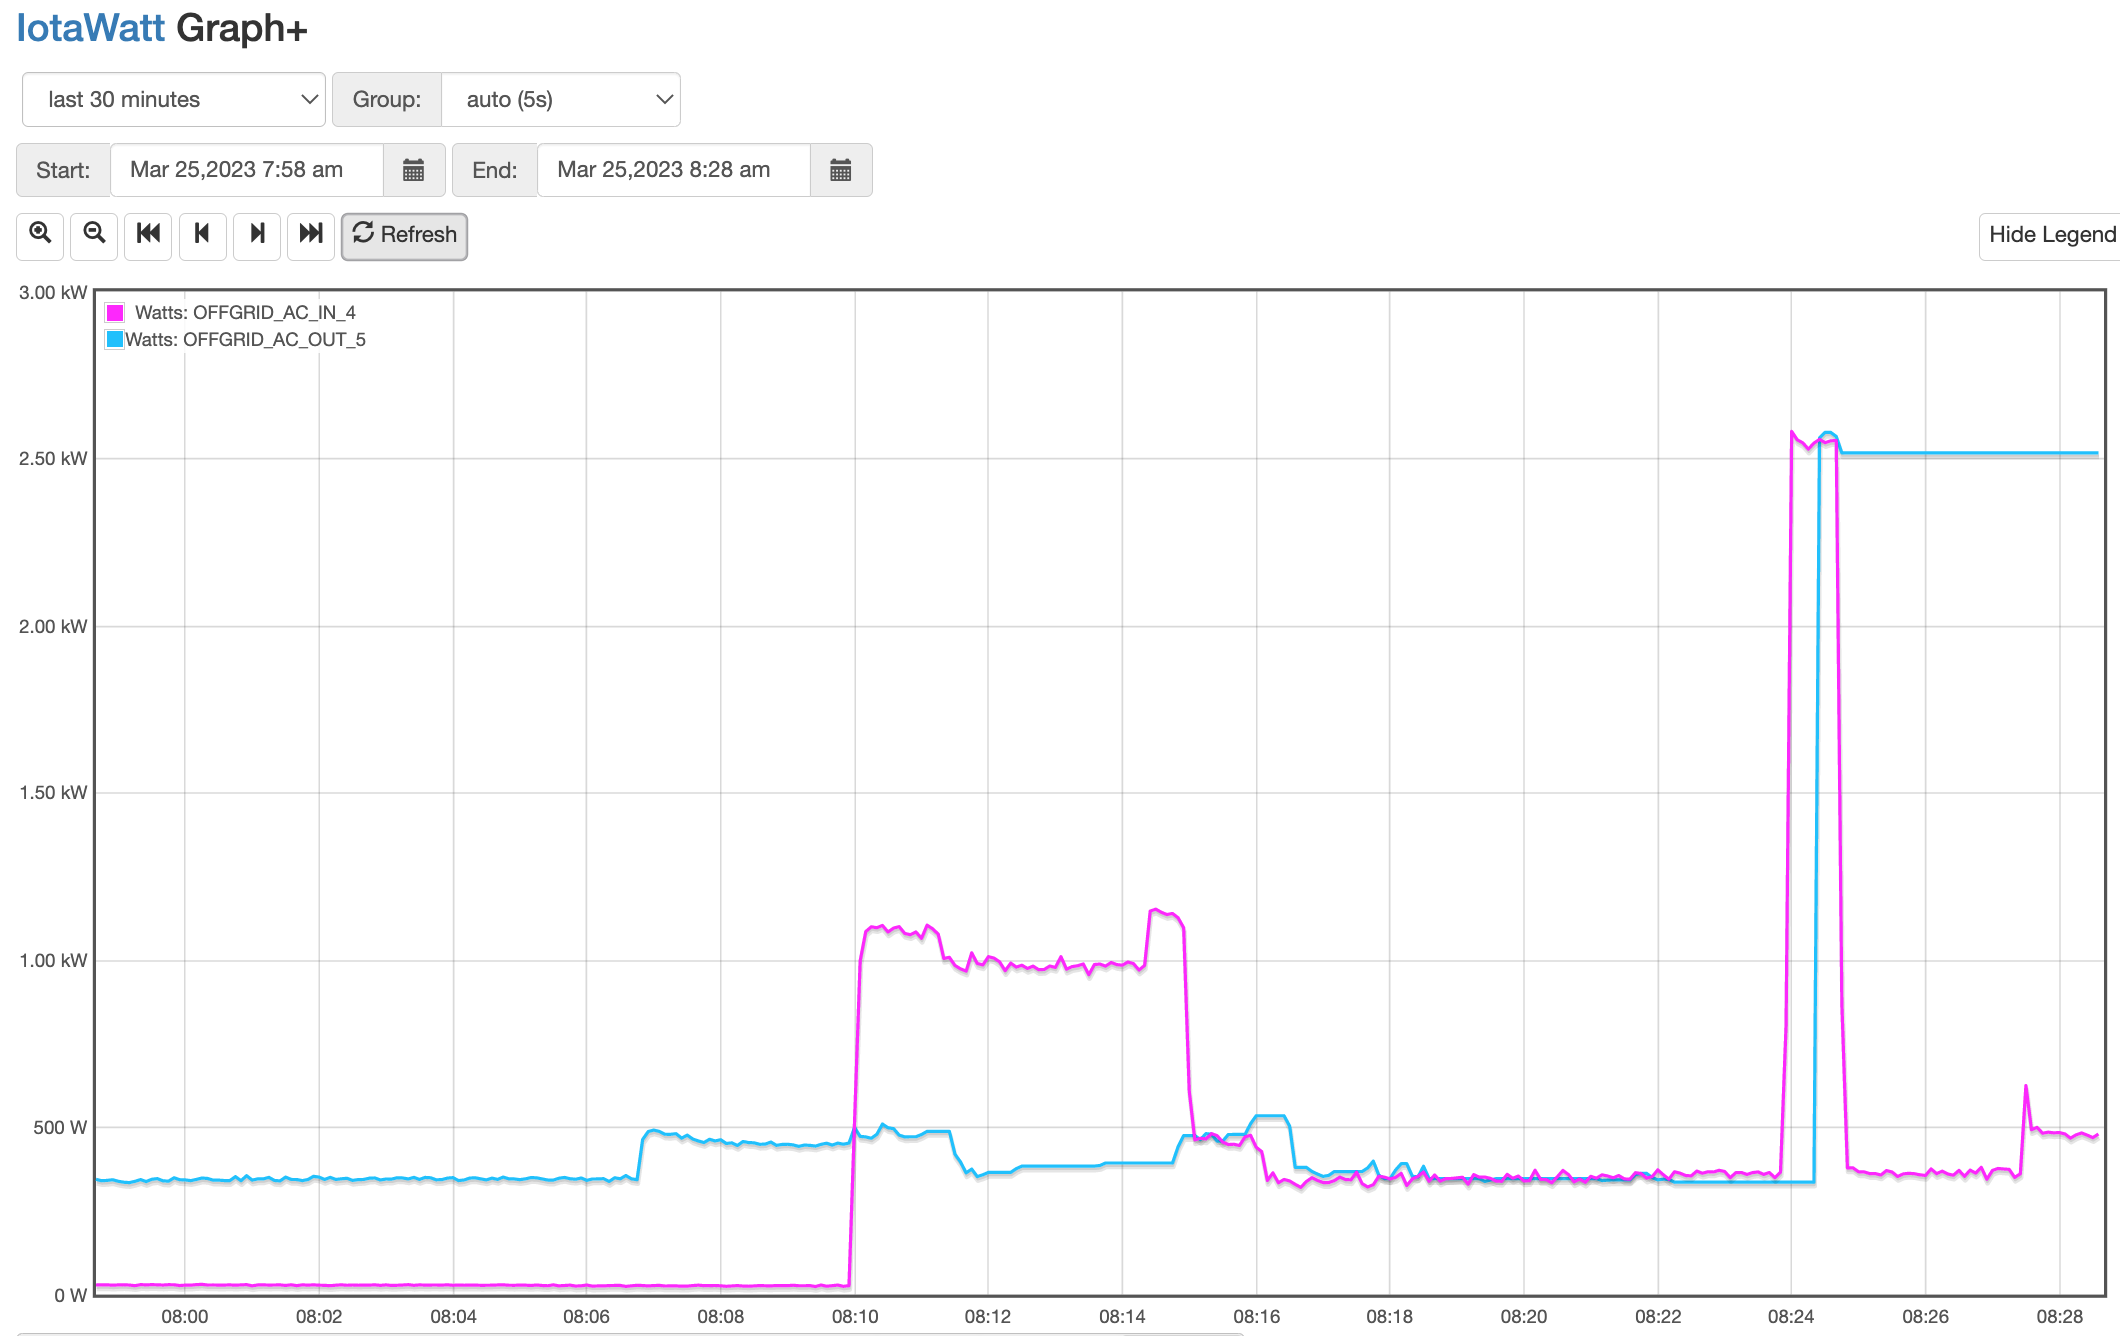
Can see the change over, and that peak on the right is my wife making a cup of tea (an instant hot water dispenser).
Here is the voltage chart for the same period:
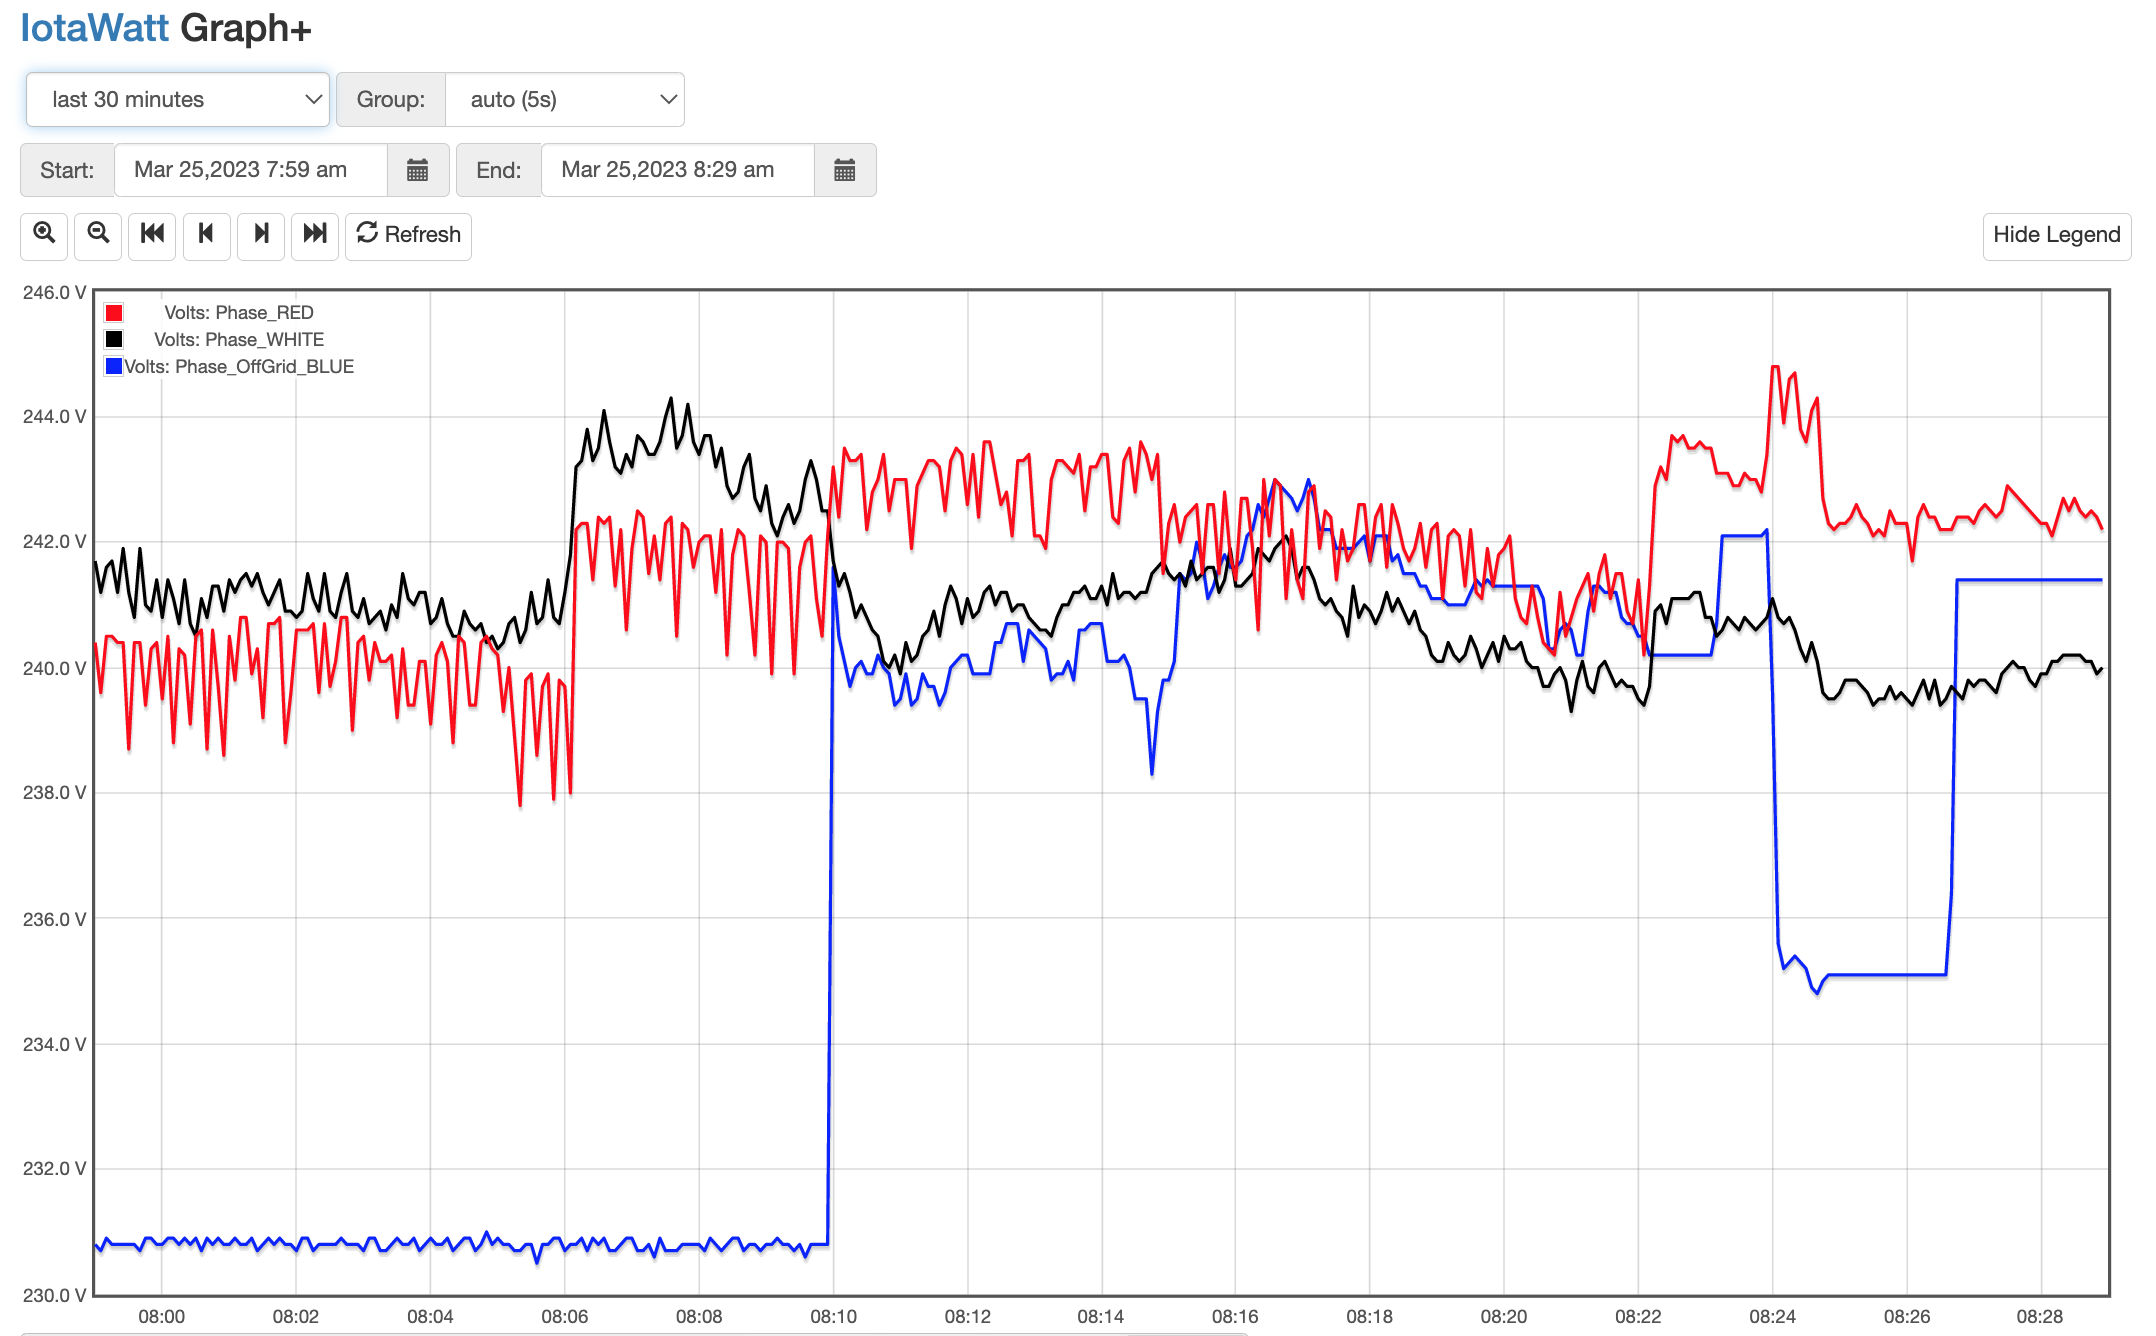
Some flat line periods showing in both charts.
Yes, I can see the water heater. You can see where the voltage starts to flatline before that, just after 8:22, then the water heater comes on just after 8:24. After a few seconds the AC-out voltage gets another sample and jumps up to match the AC-in. When the water heater shuts down a minute later it leaves the AC-out hanging in the frozen state.
The AC signal from the offgrid blue VT seems to be producing a signal that IoTaWatt cannot recognize. It has to do with how IoTwAtt samples. Most other meters just keep sampling without regard for individual cycles. IoTaWatt samples individual cycles and needs to be able to identify the start, midpoint and end by looking for zero crossings. I suspect the signal is getting muddied, possibly the inverter is using a triac to switch in the line AC rather than a contact relay.
Let’s take a look at that signal. Use the command
You should get a list of sample pairs. Do this while it is not “stuck” and retry if it fails. Copy and paste the results into a notepad type file and upload it.
This is all it shows:
Sample Channel 14, return code 1
This is when it is stuck. I will have to wait for it to become unstuck to show those results.
You are getting code 1 from the cycle sampler, so I think we are on the right track.
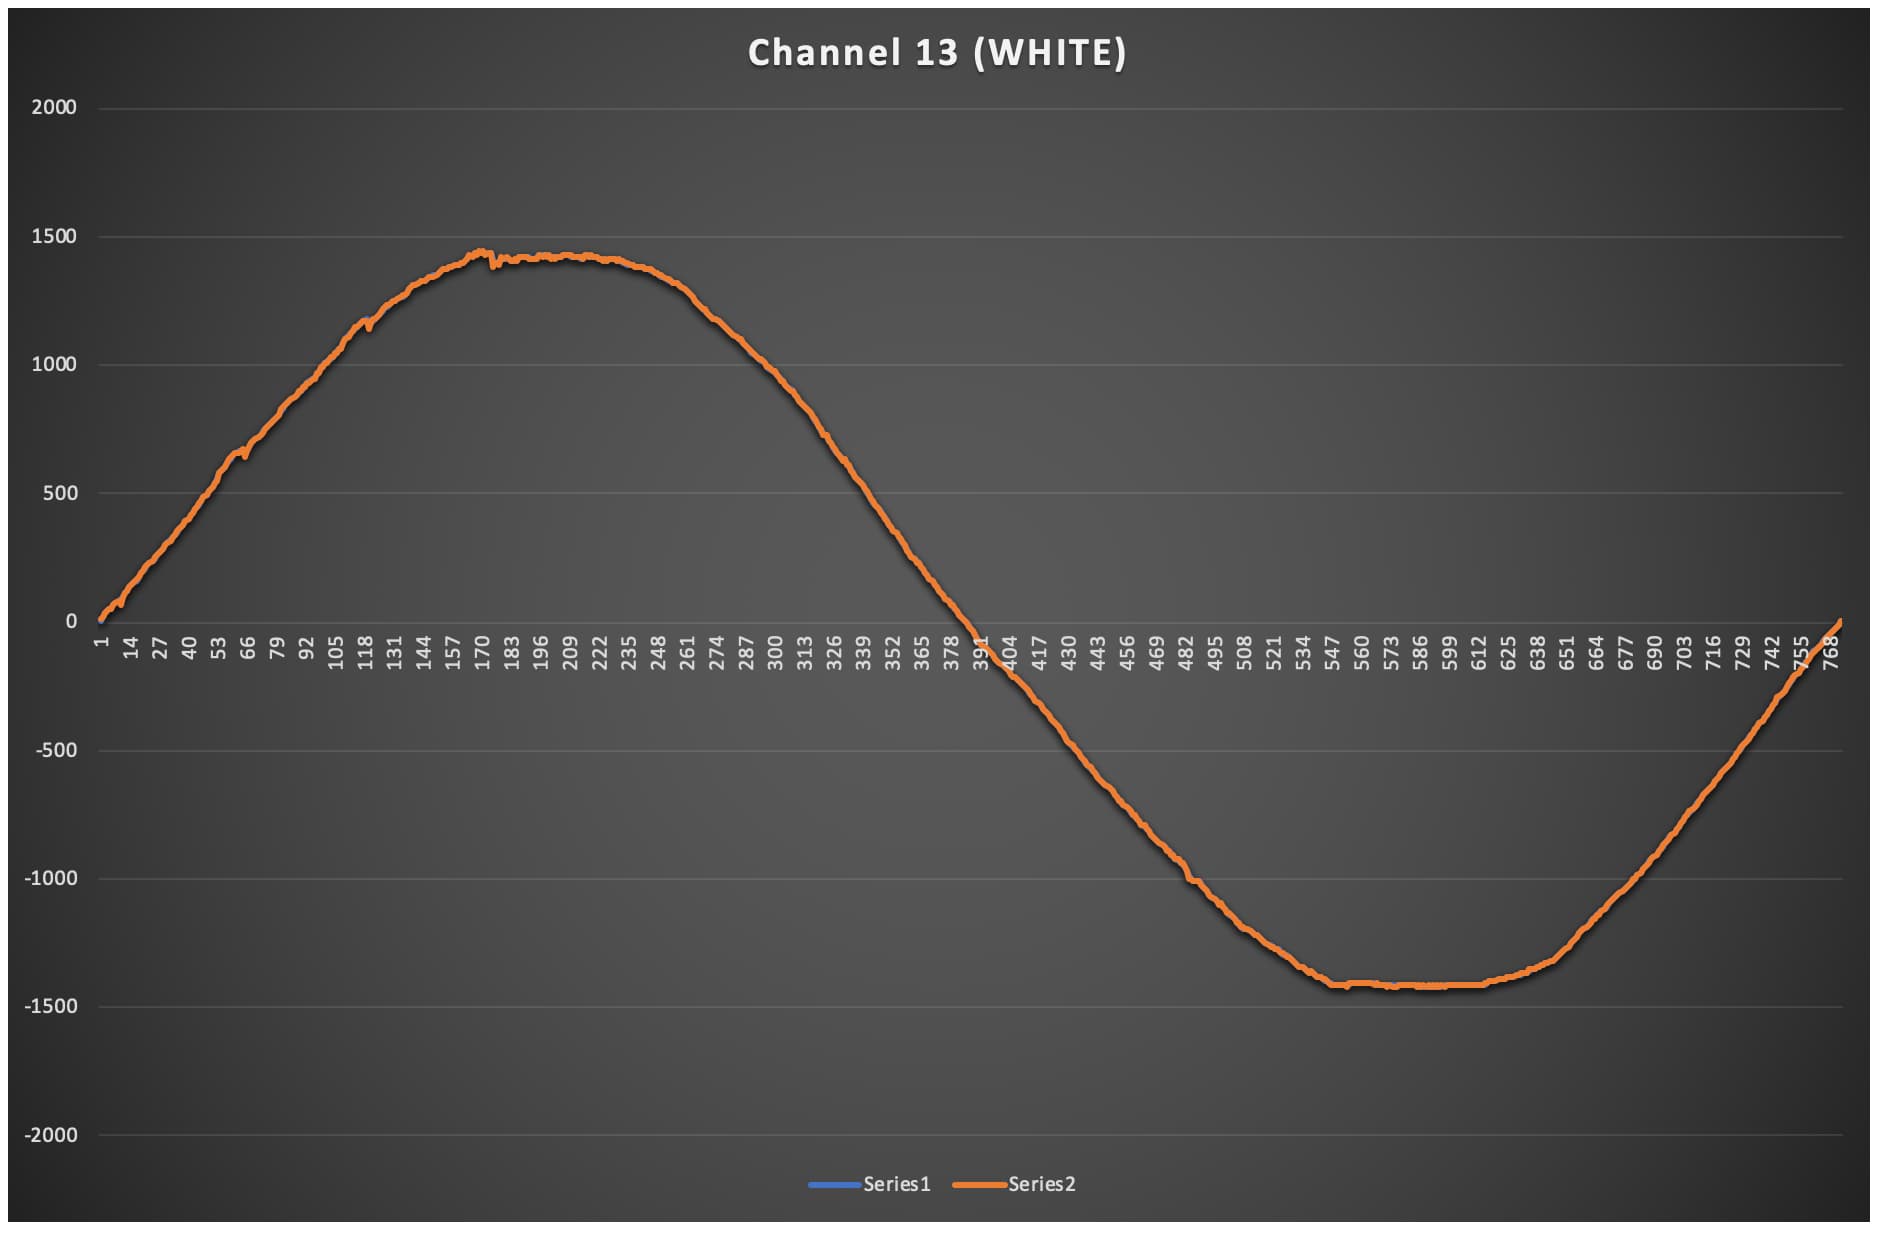
Just for curiosity I ran the same for RED PHASE voltage channel 0, and WHITE PHASE voltage channel 13.
Quickly plotted them in Excel to look at the wave form:
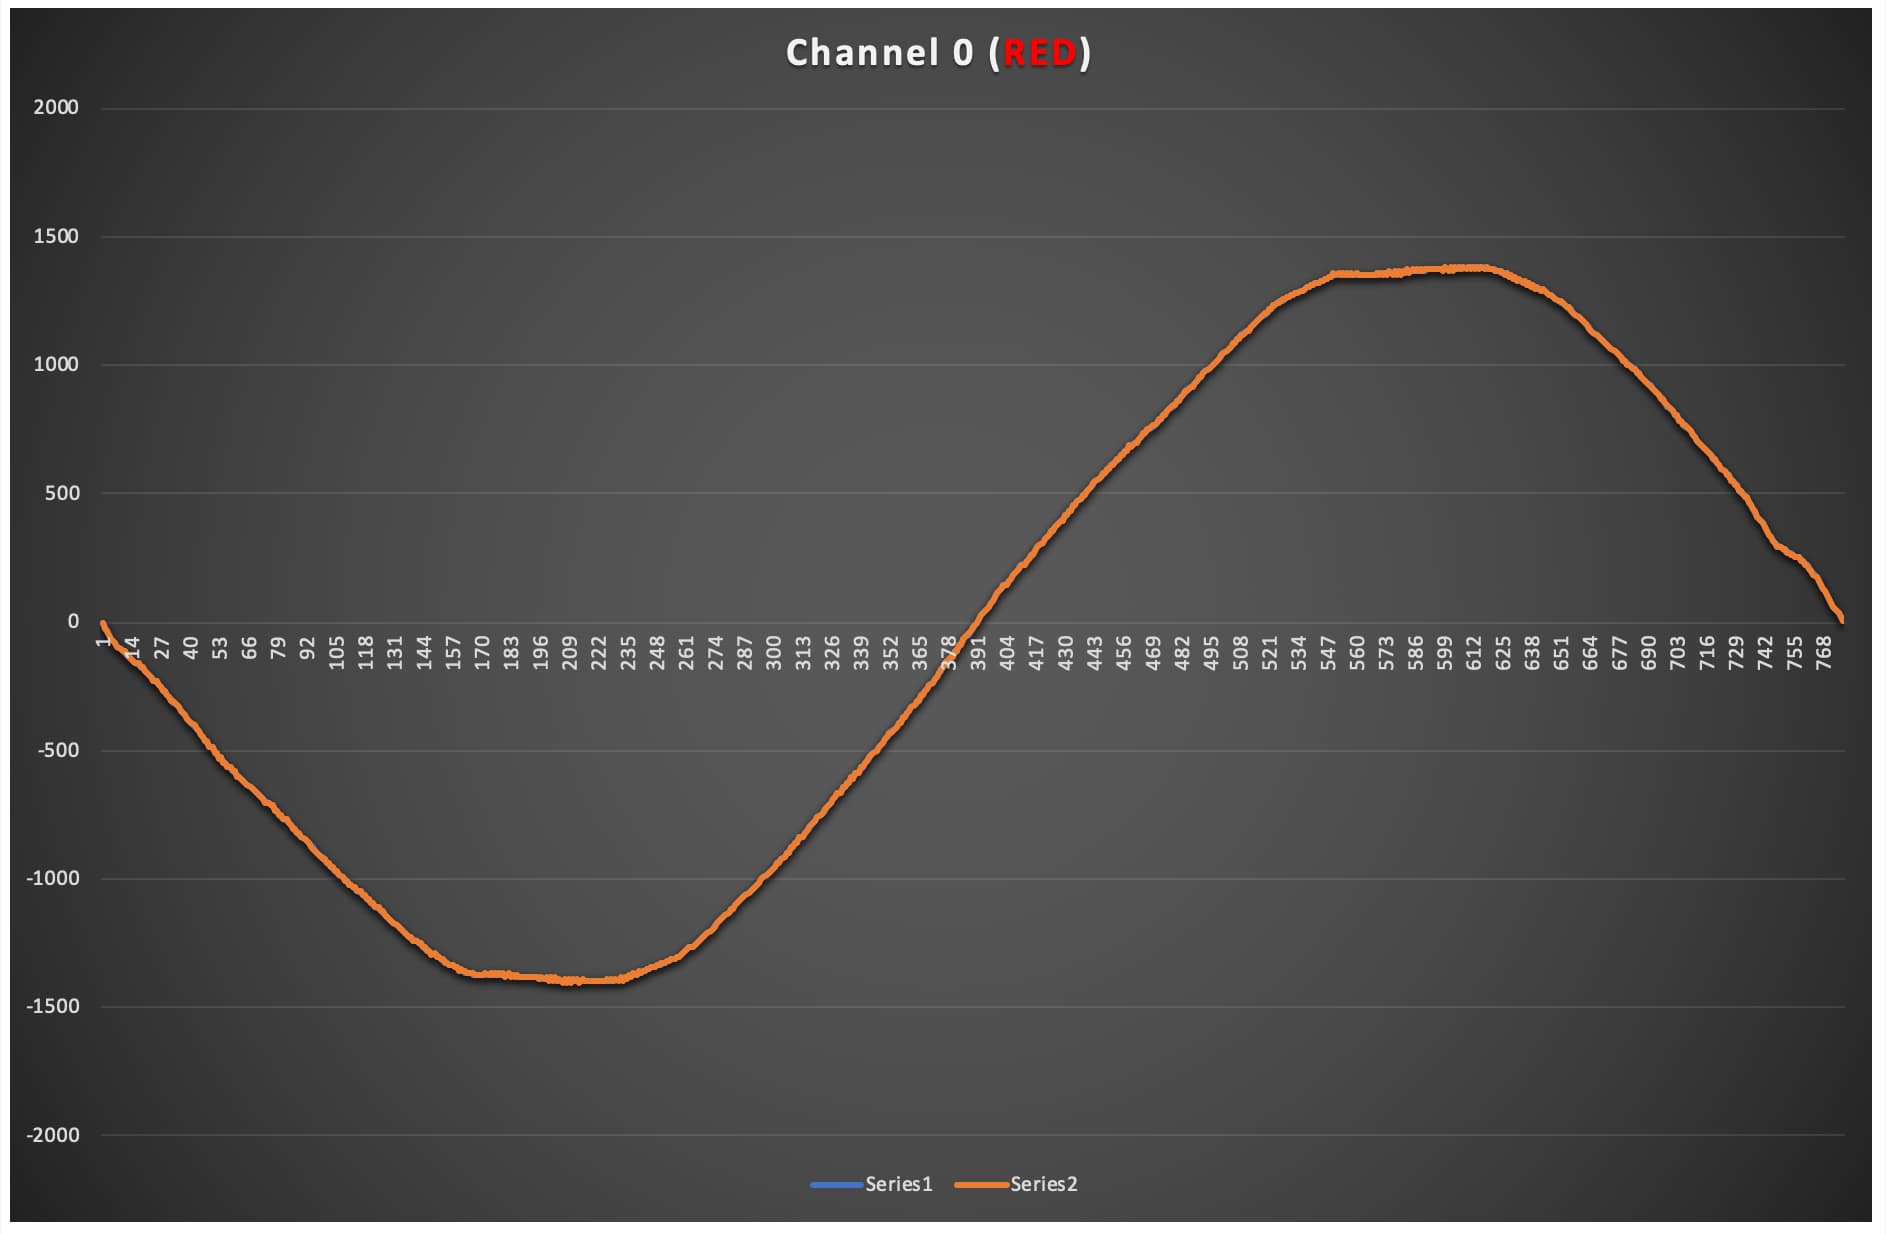
Make an engineer out of you yet.
Maths and some physics I don’t mind - I have a head for that.
But IT stuff, programming and comms, ugh.
While I wait to see if the off grid voltage sensor stops flatlining (doesn’t look like it will), in the meantime I can report a couple of wins.
- Managed yesterday to get the induction stove mystery sorted. I think!
I swapped that sensor over to using the derived voltage for phase BLUE (using RED + 240°), which is the phase the stove operates on (a non-essential load).
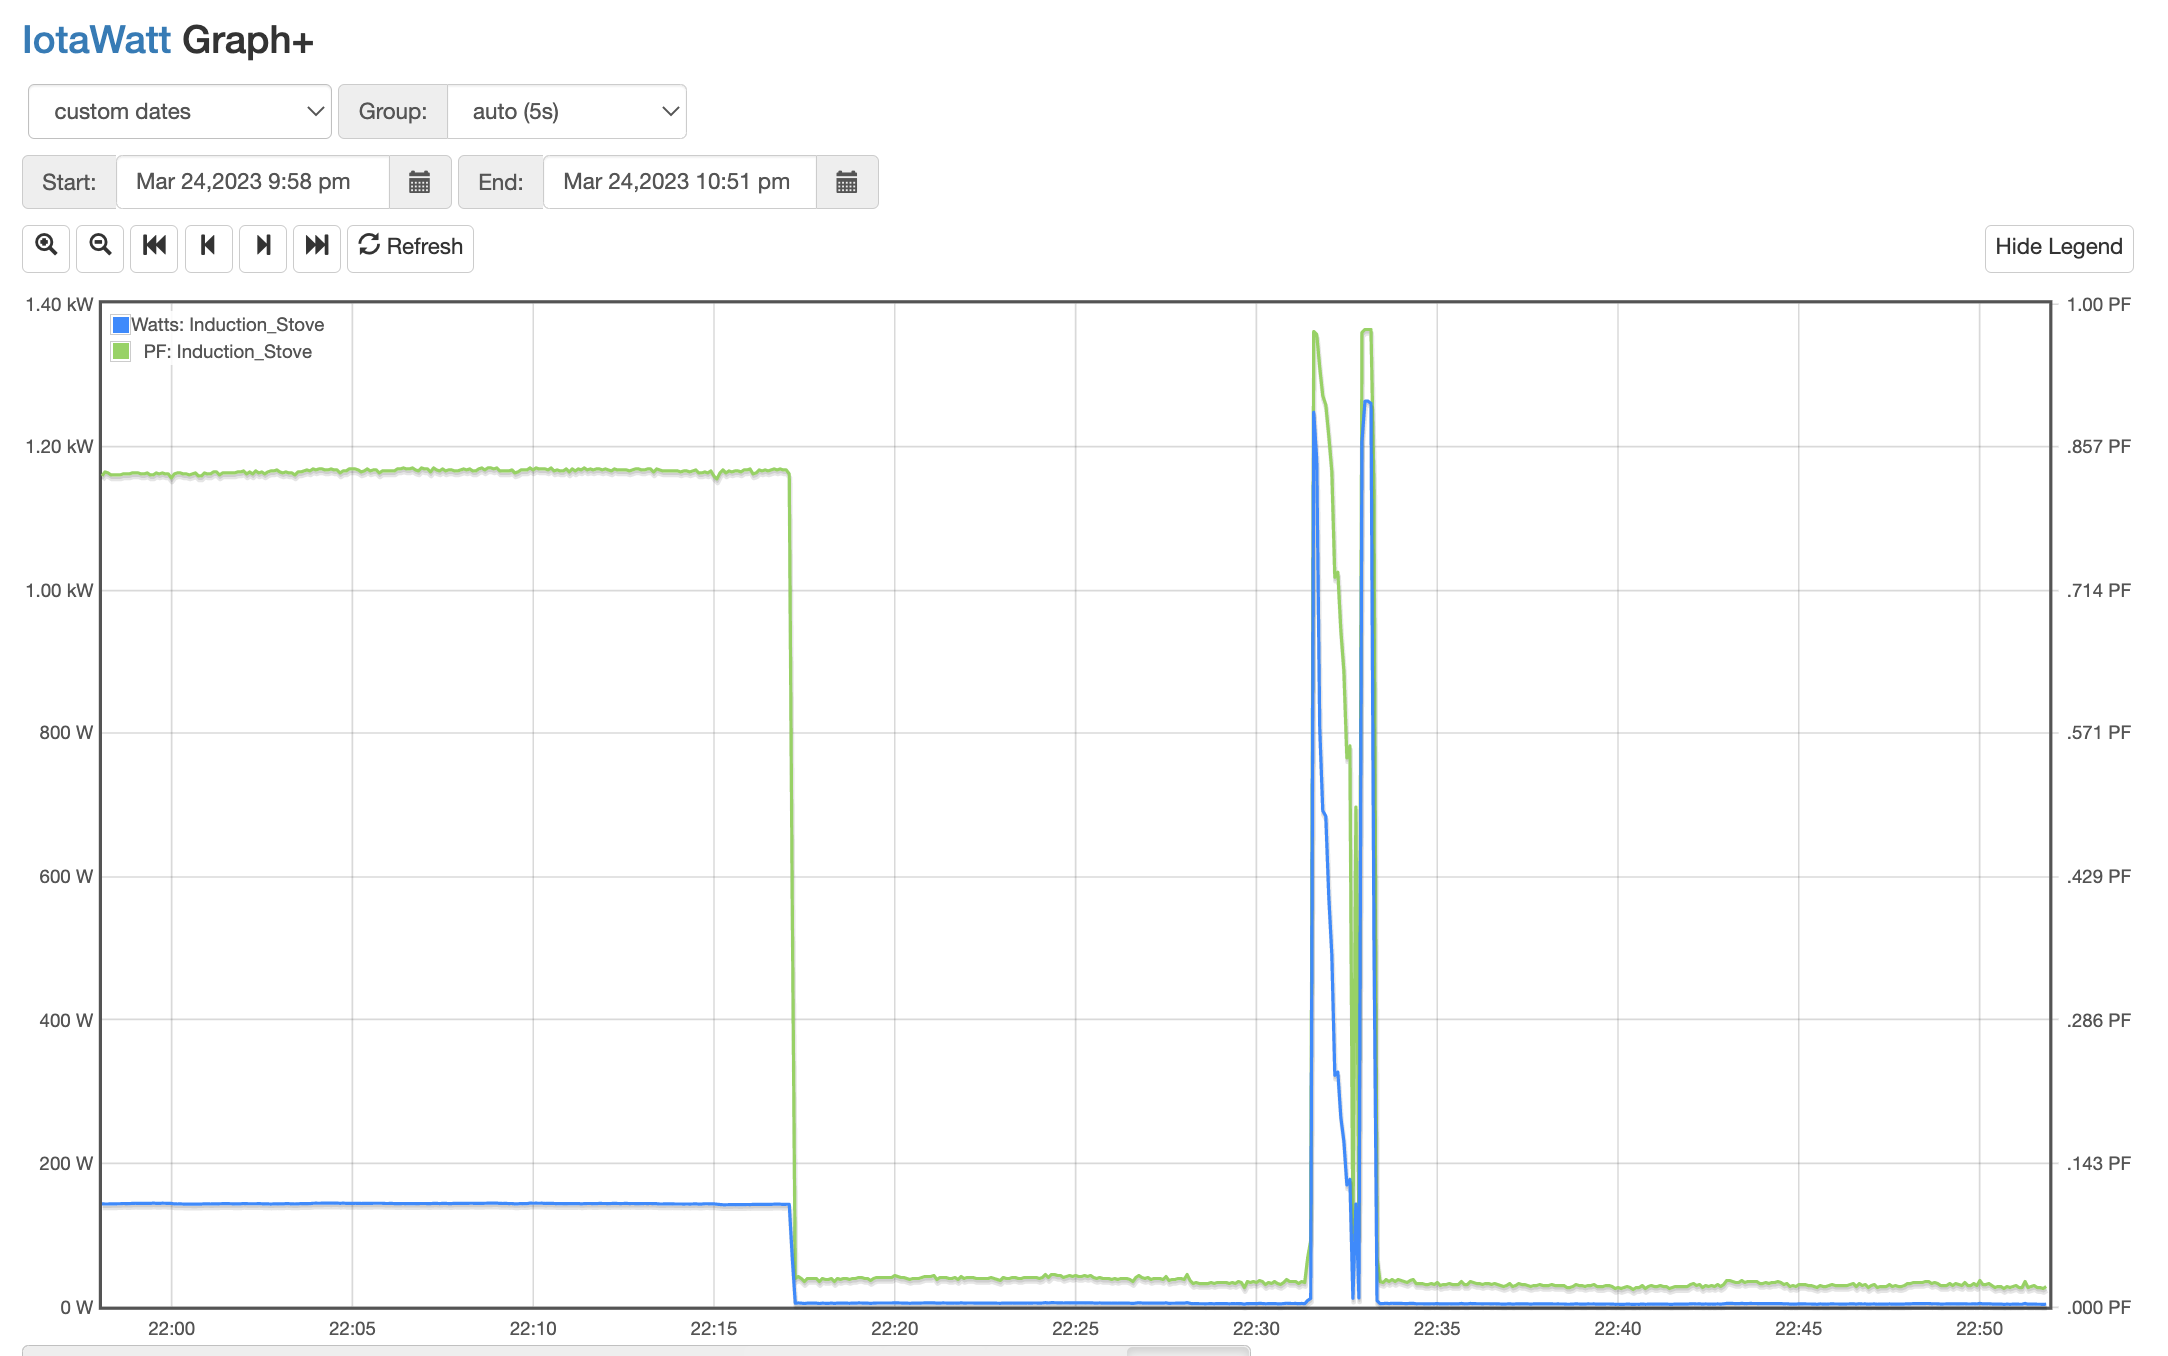
Chart shows roughly an hour of data for the induction stove.
At the left it shows the reported power was sitting at ~150 W even though the stove was off. Meanwhile the PF was showing fairly high value.
Then at ~22:17 I change the voltage reference to use the derived voltage for phase BLUE and both the reported power and PF dropped right down. A bit after 22:30 I turn on a small hob of the stove and the power draw is in line with expectations while the PF shoots up close to 1.
Tested running at different power settings (for short periods) while watching the status screen. Started at high setting, then gradually ramped down to low (9 levels), then back to high for a bit.
At some settings it tends to cycle power on/off rather than just hold a lower power level. Here’s a zoom in on that short period of testing when it was on:
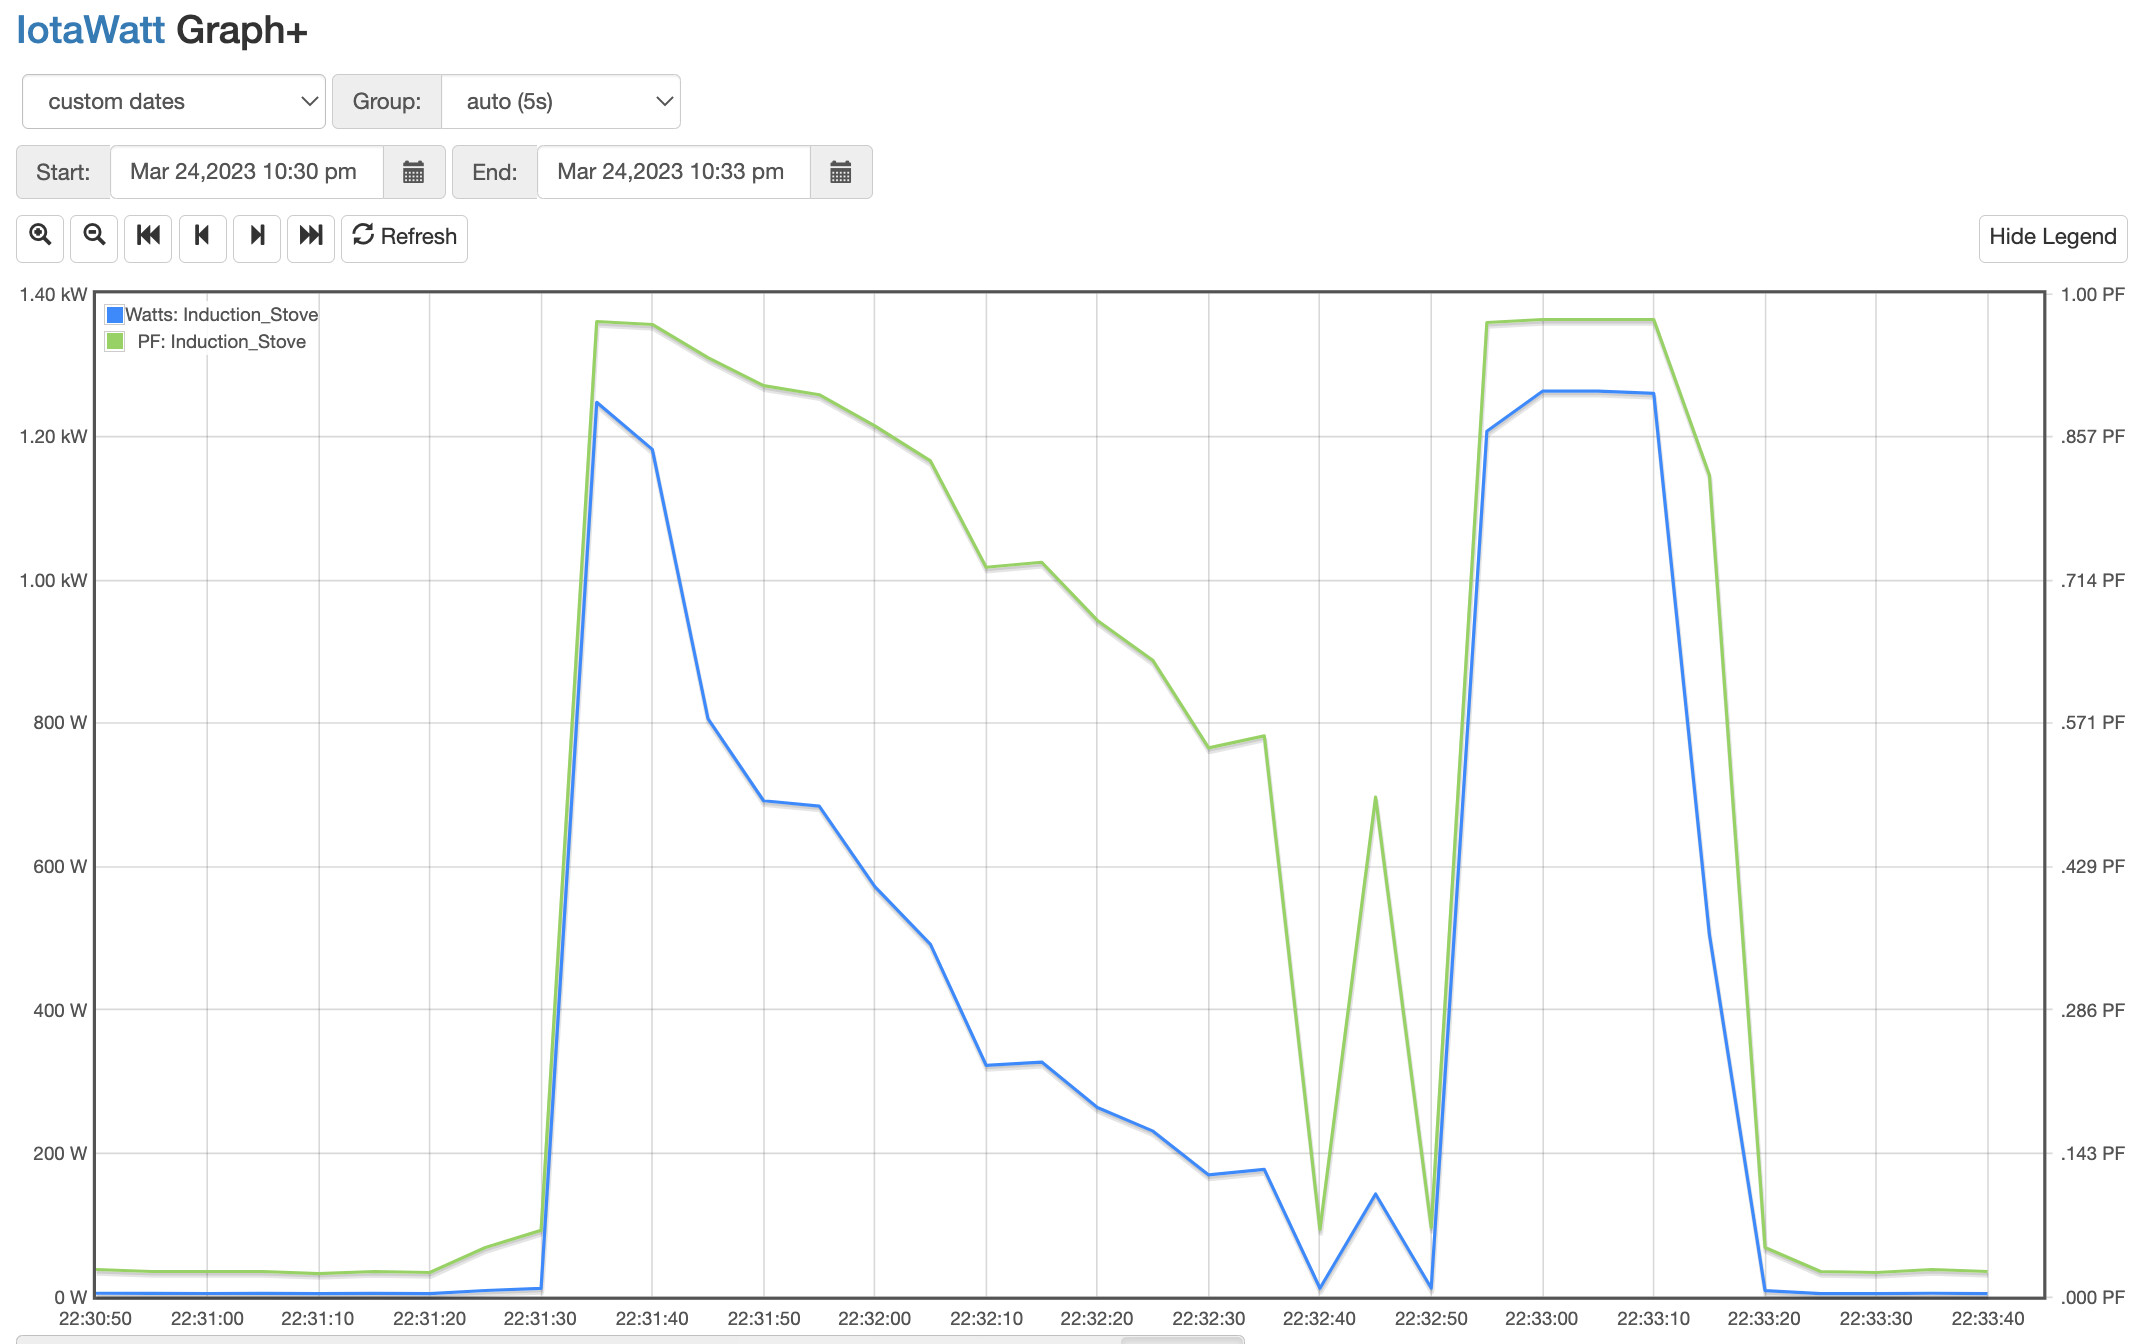
I’m assuming the chart is showing an average of samples for each 5-second interval rather than a snapshot sample once every 5-seconds. It would make sense given the way the unit cycles power on and off.
When off it now shows an idle power draw of a small handful of watts.
So I think that’s now the right setting for the stove.
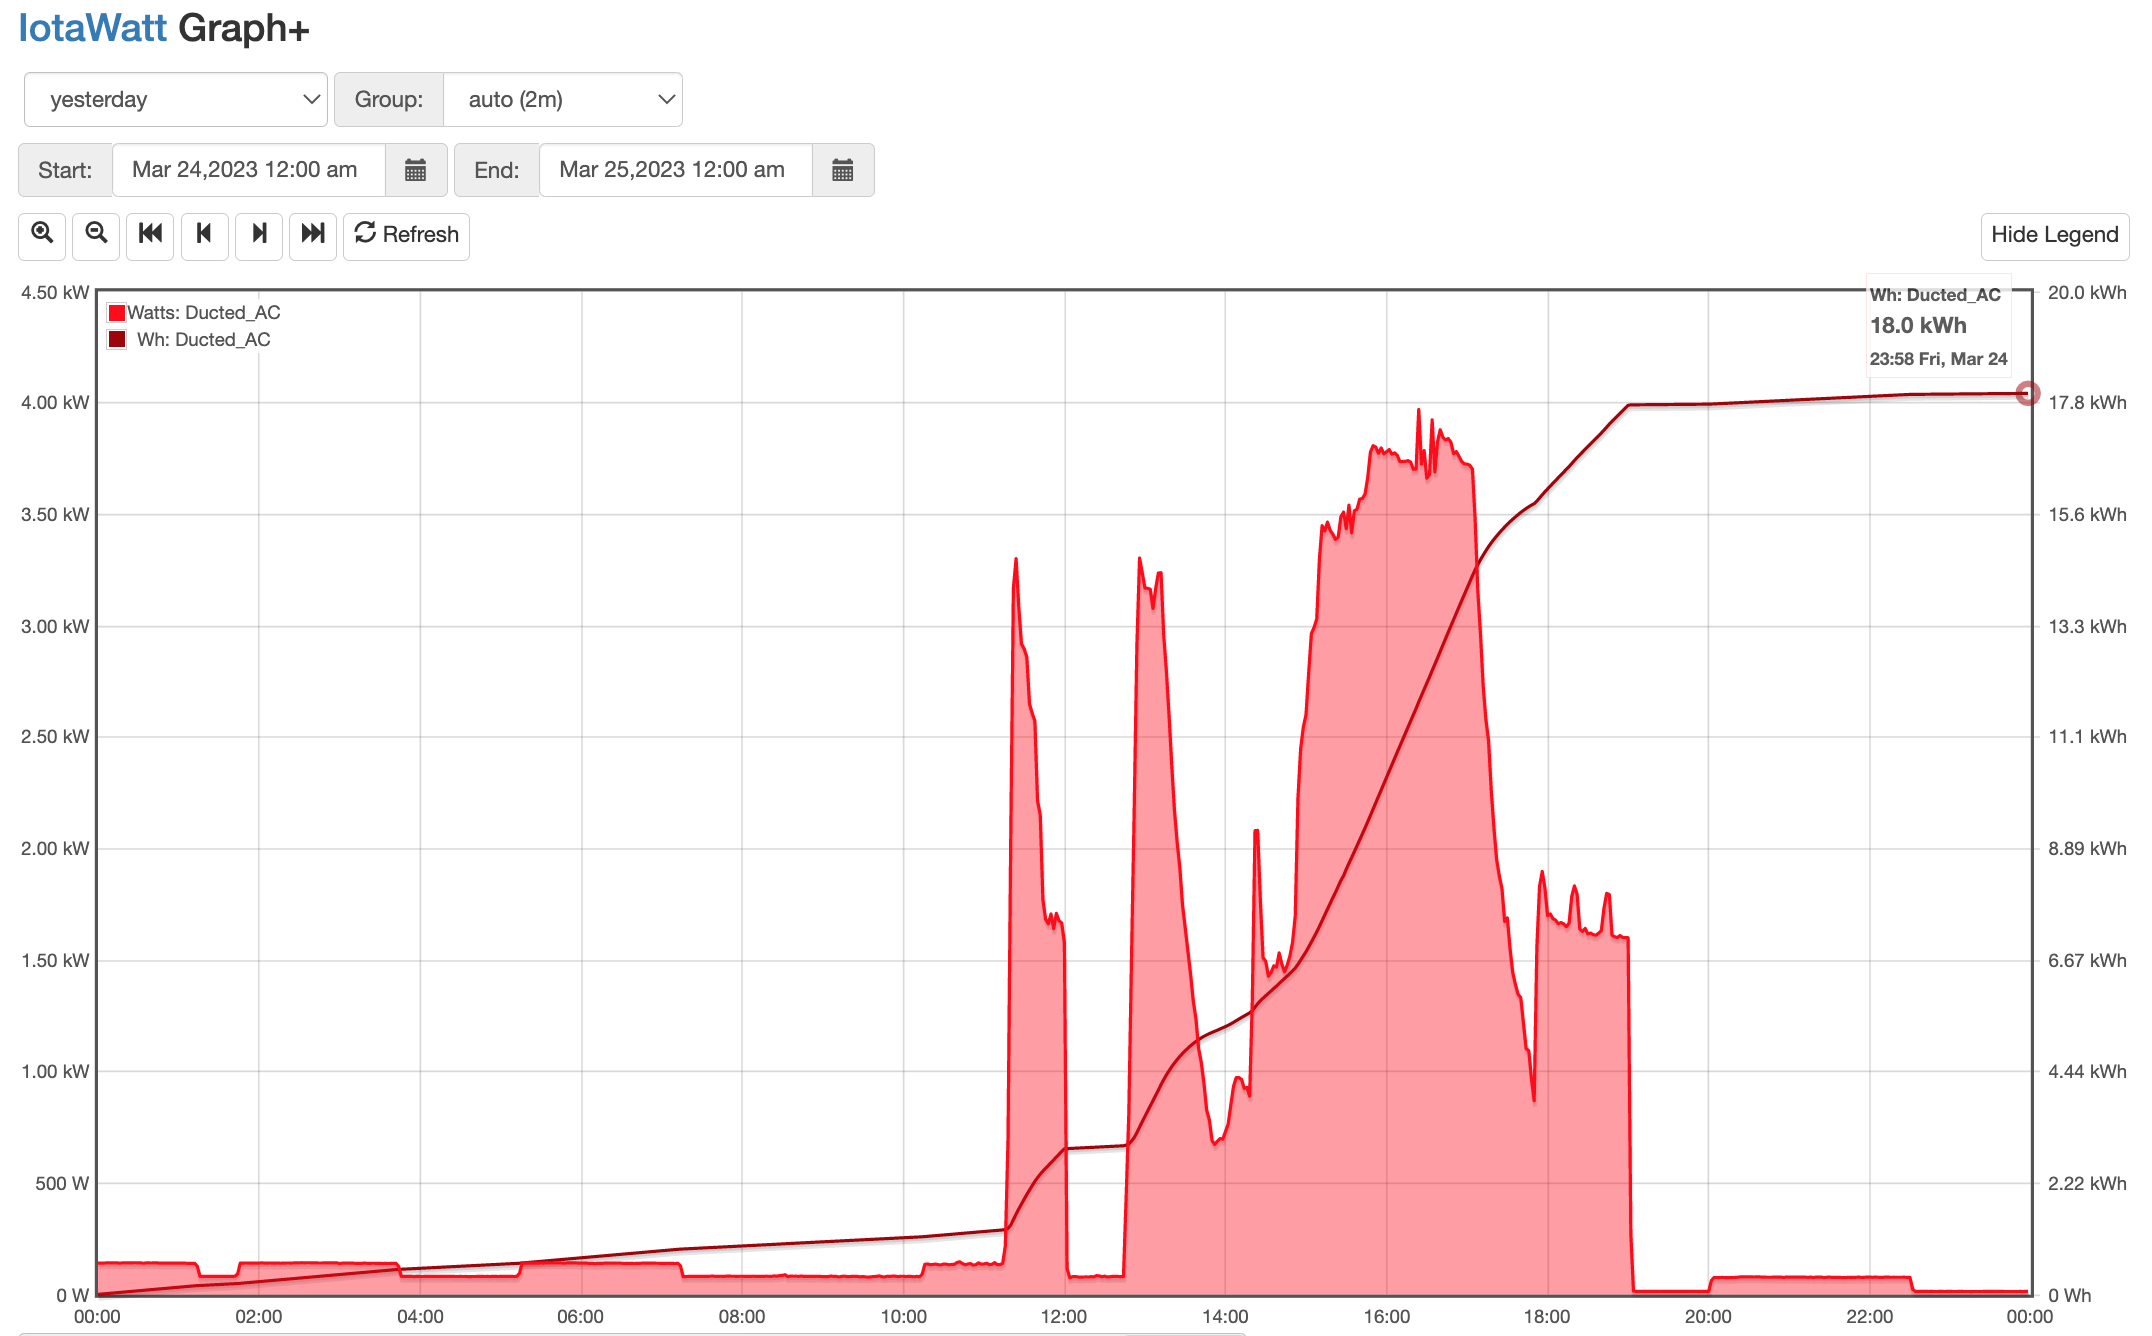
- My ducted aircon seems to be reporting correctly as well, again that’s a non-essential load running on phase WHITE. Yesterday’s chart of power consumption and accumulated energy.
I’m taking these small wins while we unravel the rest of it.
OK, I had to wait a while but noticed a few minutes ago it started to report voltages. Else all day it’s been in the flat line mode.
Attached is csv of the data.
BLUE.csv (8.2 KB)
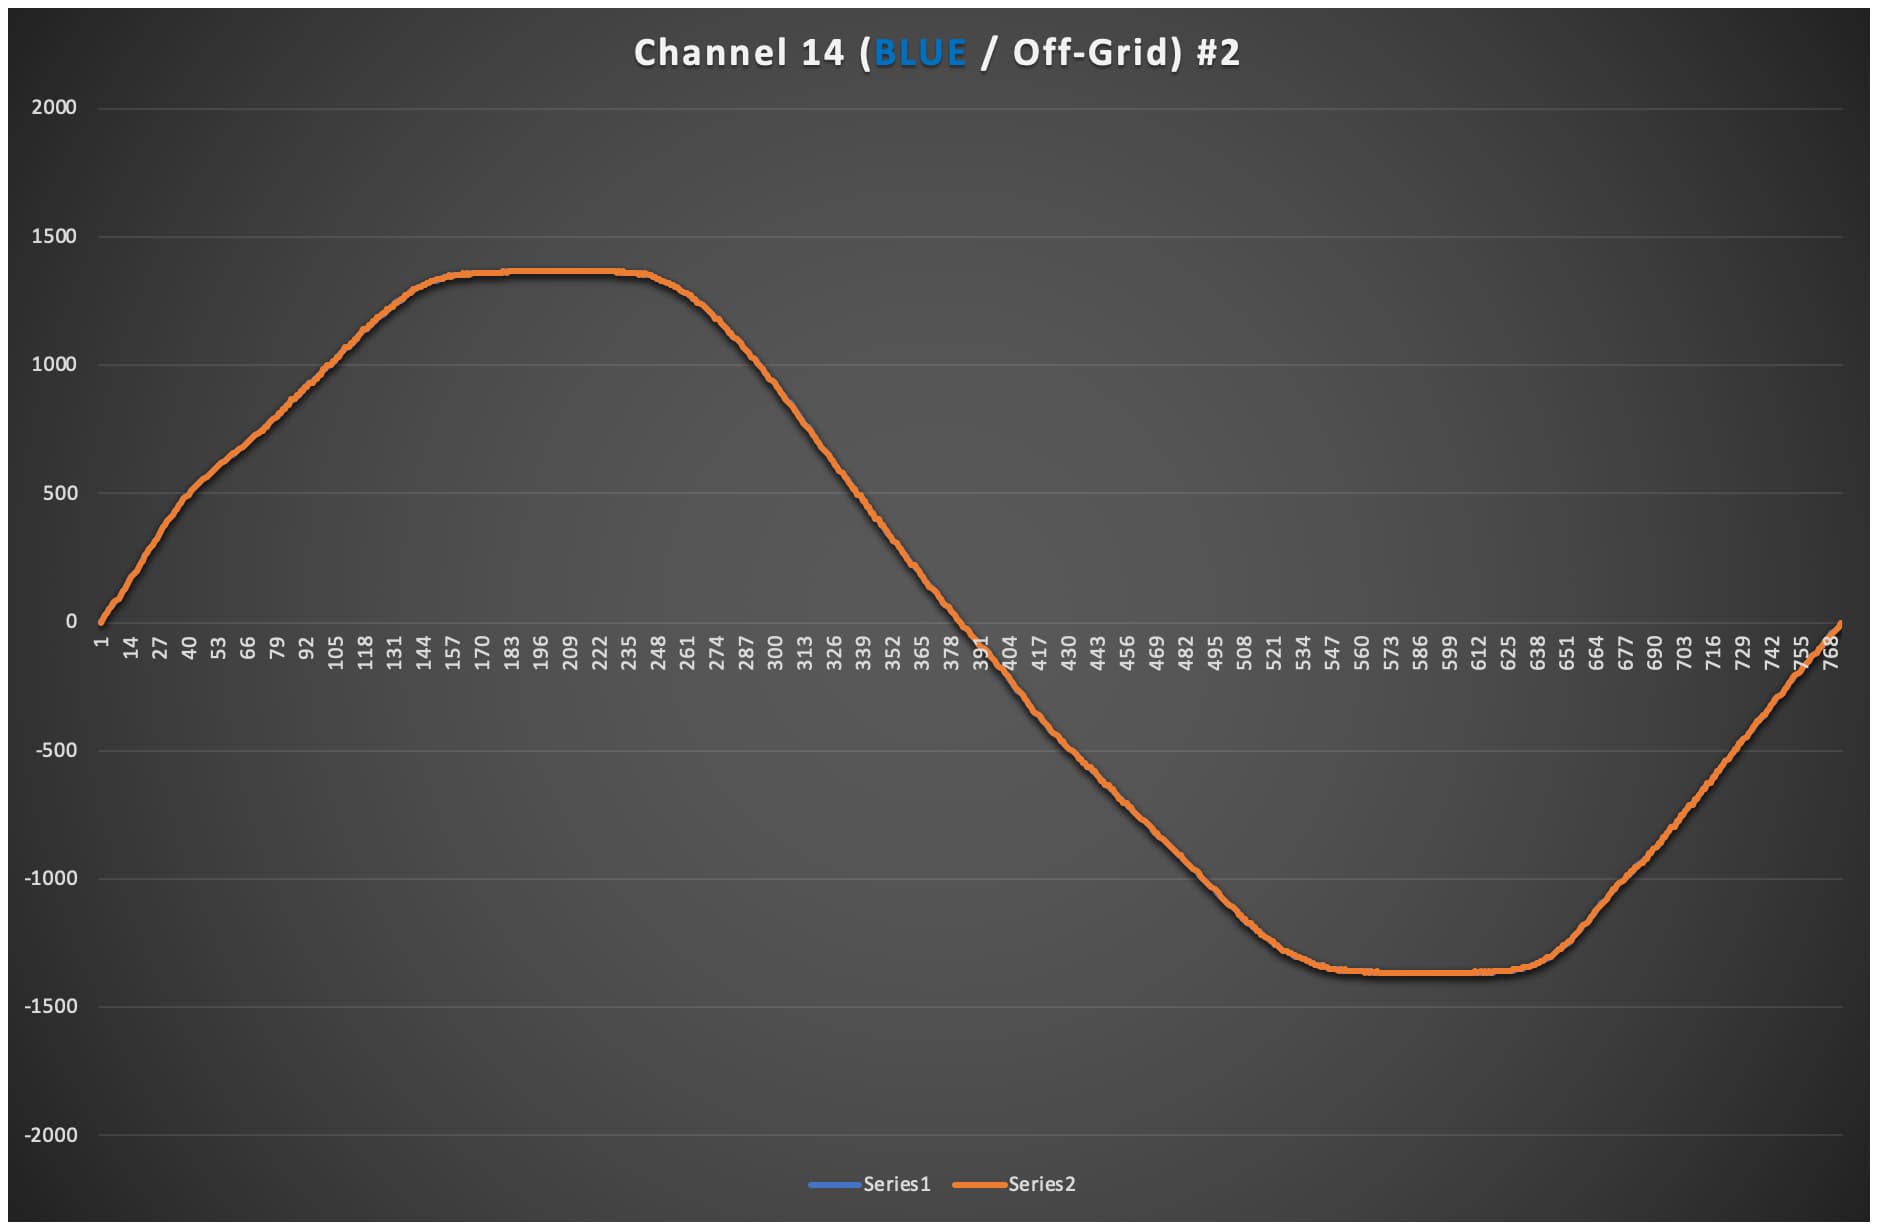
And for good measure I plotted it:
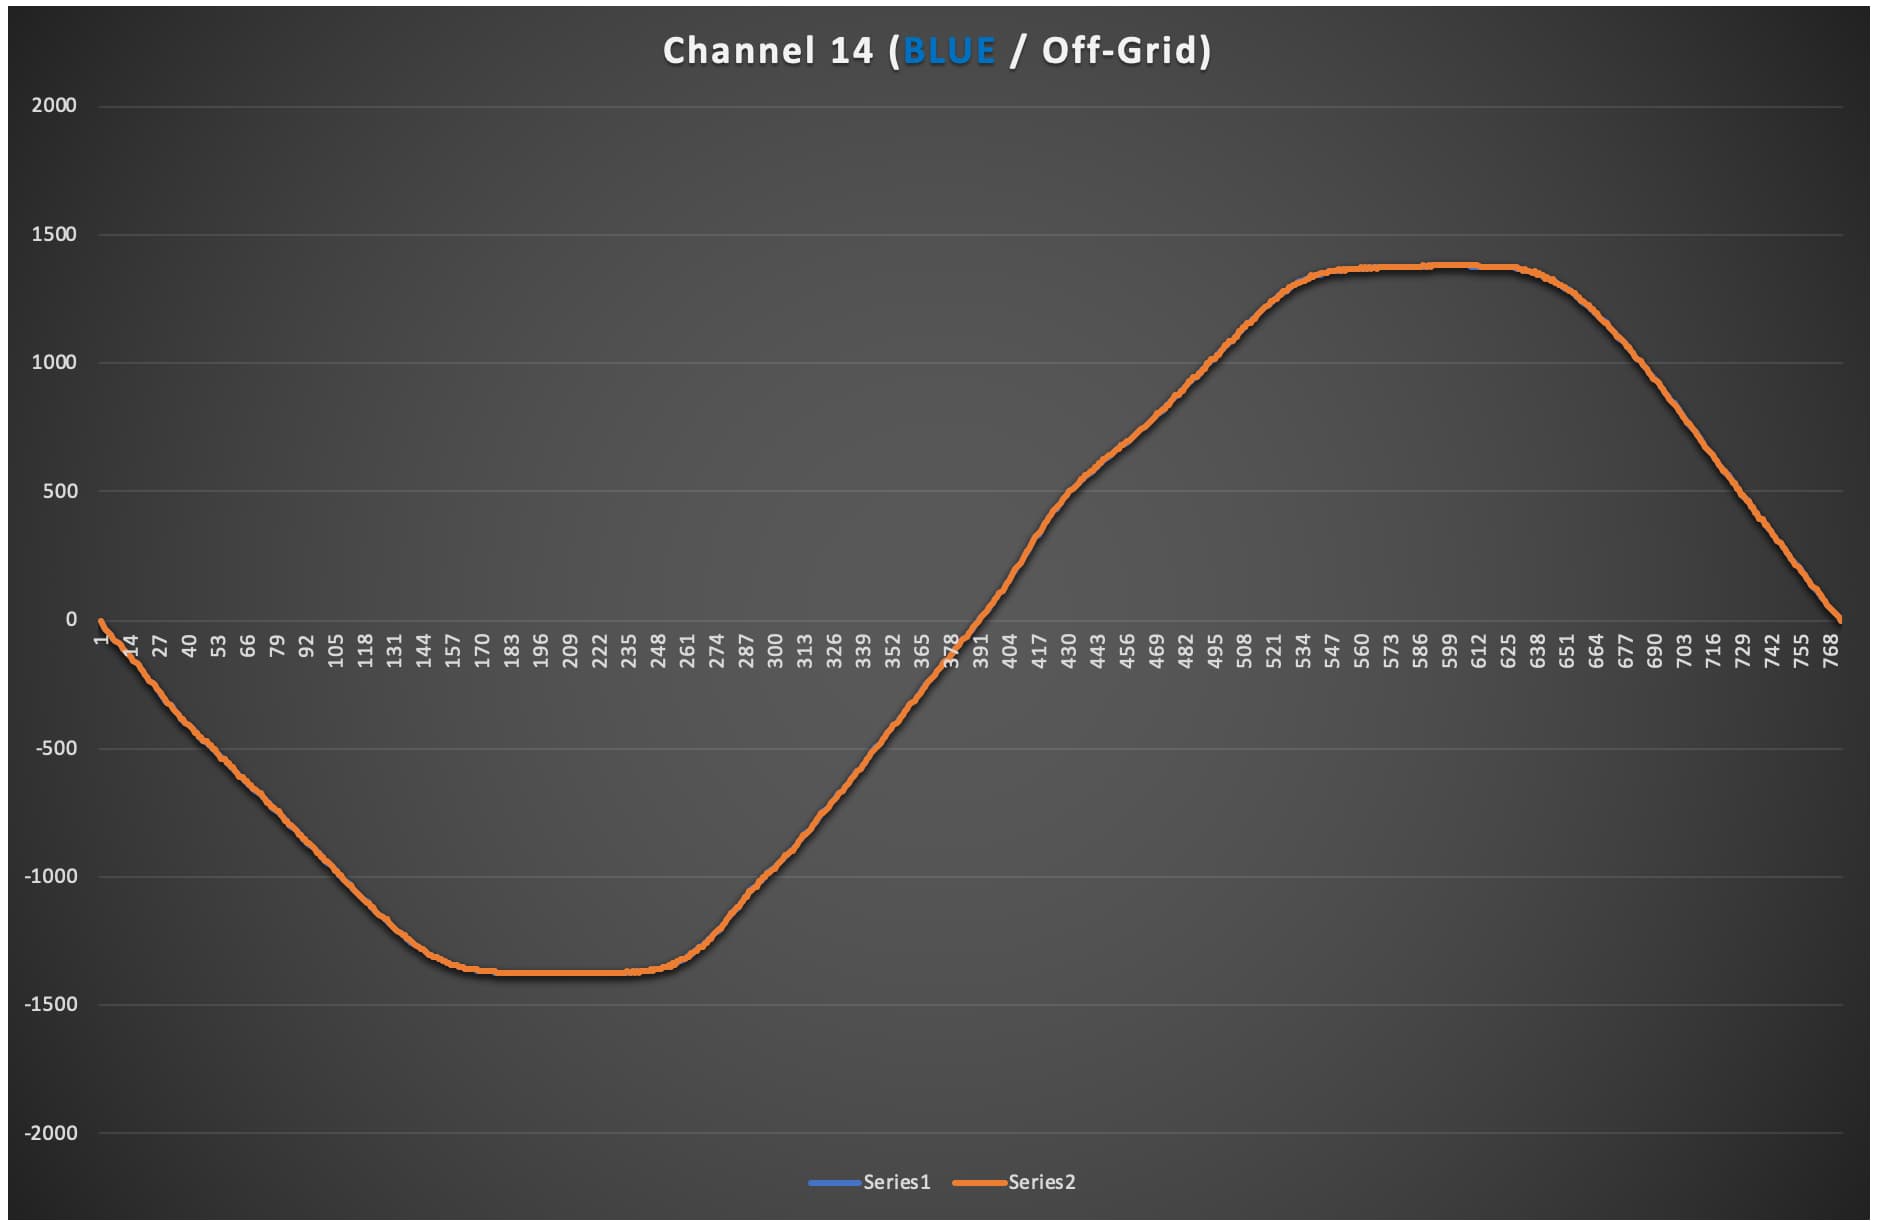
Interesting waveform.
and another sample not long after that:
BLUE2.csv (8.2 KB)
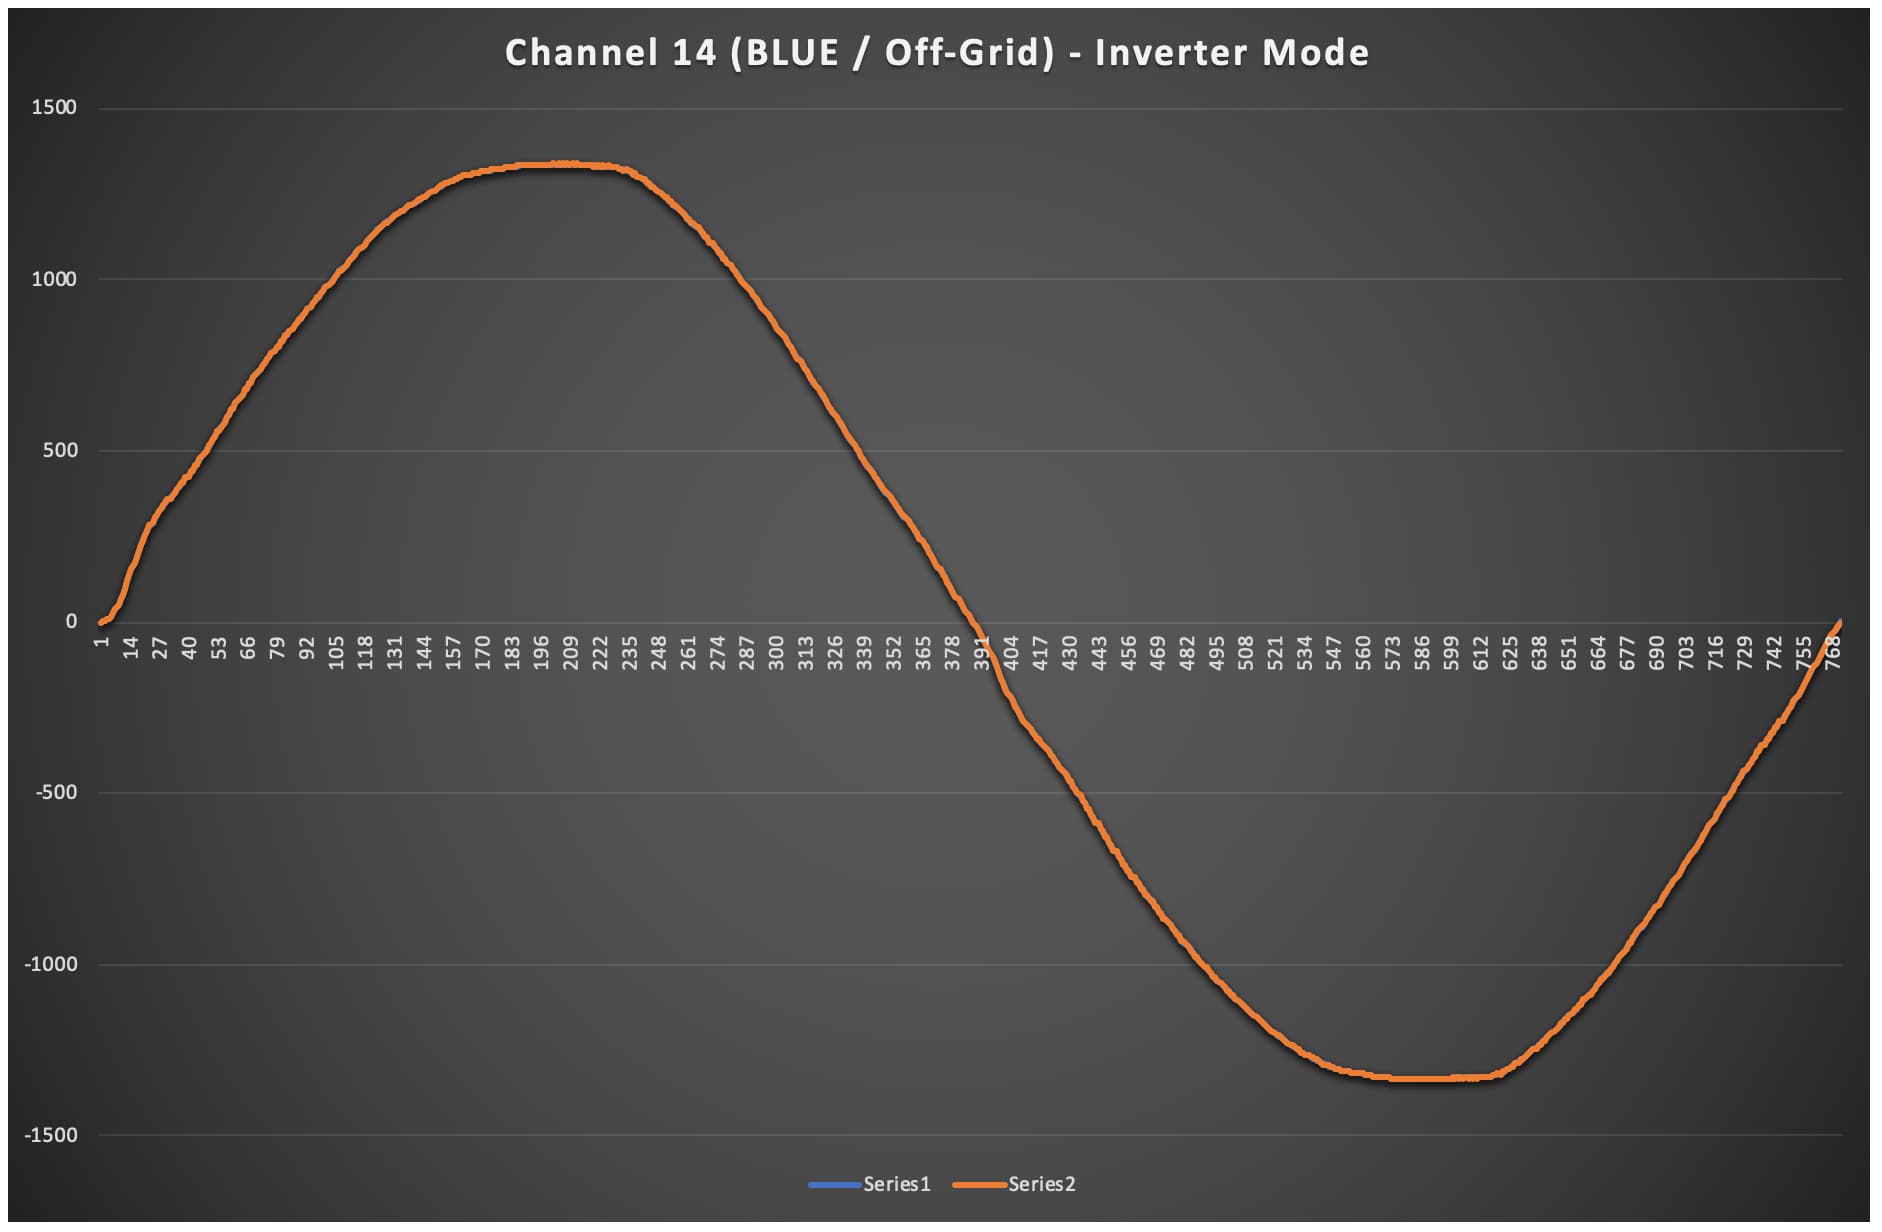
And for completeness, here is the sample data and chart for the inverter which has now (late afternoon) switched over from passing through grid power to operate in inverter mode.
OffGrid_InverterMode.csv (8.2 KB)
Chart:
Thanks
What this is telling me (correct me if I am wrong) is that:
i. my ISP sending me extra network extenders is not really helping, indeed it could be exacerbating my connectivity problems.
ii. this sort of system for provision of Wi-Fi coverage has fundamental flaws
Looking at my IotaWatt log it’s showing multiple W-Fi channels. I can see in last few days that it has connected, at times, to channels, 1, 2, 3, 4, 5, 6, 7 and 11.
I’ve no idea why so many different channels as I don’t have that many network devices. Anything other than channels 1, 6, 11 would seem to lack sufficient bandwidth separation.
Think I’ll remove one of the extenders. Perhaps this is also what has caused Wi-Fi connectivity issues with my Fronius inverter and also my Solar Assistant Raspberry Pi (for the off-grid inverter monitoring/management). I eventually gave up and connected an ethernet cable to both.
One more - the resistive element water heater with smart PV diverter:
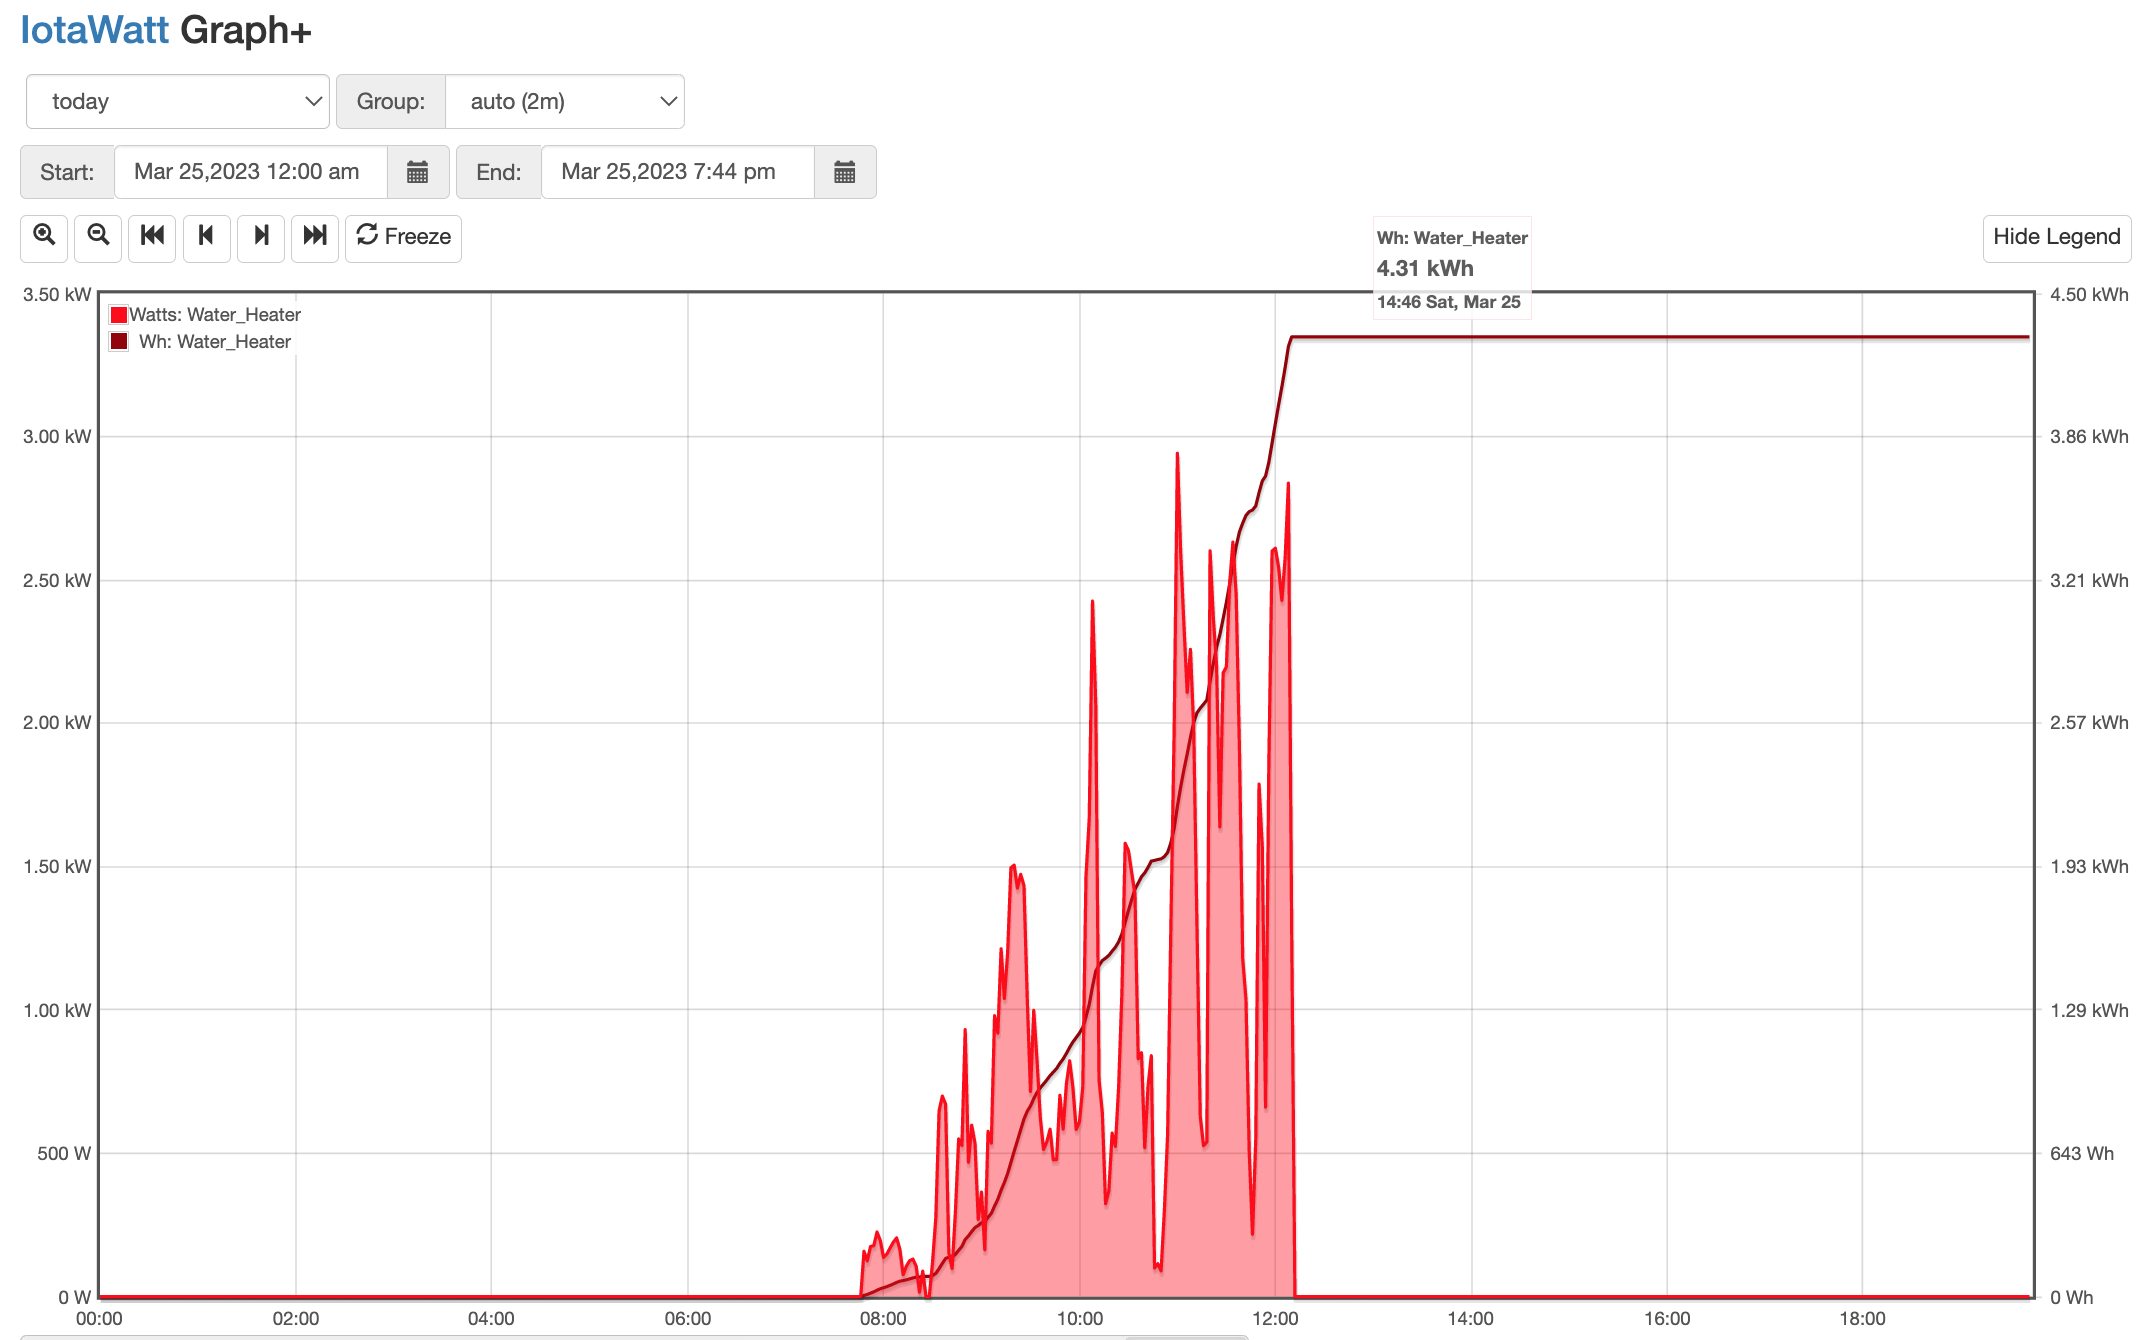
The diverter varies power delivered to the water heater based on available excess solar PV production so as to ensure grid imports are avoided.
Can see the power jumping up and down a lot as it was a cloudy / rainy day with sun poking through at times. Water heater’s thermostat switch opened a little after midday indicating end of heat cycle. The rain set in for the afternoon, so no brief top ups which it sometimes does on a sunny afternoon.